
Overview
How Atomgigs works: sources, catalysts and buyers
Atomgigs does not build machines. It helps makers go to market, advises buyers and delivers work done and data.
- Go-to-market: where, how and to whom
- Gigs: jobs for their machines and talent
Paid by Makers: GTM fees; buyers: per gig
- Advice and investor diligence
- Project bidding and execution
Paid by Catalysts: advice, projects
- Hyperscalers
- Colocation providers
- Neoclouds
- AI labs
- Enterprise and edge
- Automakers
- Other manufacturers
- 3PLs (logistics firms)
- Carriers
- Warehouse operators
- Builders and owners
- Program managers
- Energy and power
- Mining, oil and gas
- Transit and telecom
- Public works
- Police, fire and rescue
- EMS
- Security operators
- Corrections and border
- Military installations
- Defense primes
- Healthcare
- Hospitality
- Real estate, facilities
- Food service
- Retail and agriculture
- Waste and recycling
- Data to train robots
- Real-site task data
- Video and sensor data
- Labs pay for the data
- Buyers get a discount
We offer Advice and work done for buyers; data for physical AI labs. Paid by Buyers: advice, capacity; labs: data
Numbers 01 to 12 are primer numbers: each box has its own detailed primer.
Physical AI investing at a glance.
Ten facts that frame the investment landscape.
$27B+ in robotics funding
Raised Jan–Sep 2026, above any prior full year; about $15B in 2025 (Crunchbase).
The pace is rising
$9.9B raised in Q3 2026 alone, against $4.3B in Q3 2025 (Crunchbase).
603,307 robots installed
Industrial robots installed in 2025, up 11%; 5.08M now work in factories.
China leads installs
354,000 of 603,000, or 59%; the U.S. is second with 38,400.
$720B+ of data center capex
Four hyperscalers’ 2026 outlooks, against about $450B in 2025.
$61B for Anduril
Defense autonomy draws the largest rounds; defense tech raised $8.5B in 2025.
Price runs ahead of revenue
Agility priced at $2.5B with $1.8M revenue; ABB Robotics agreed at about 2.3x sales.
Listings have begun
Unitree listed in Aug 2026; Agility began trading on Nasdaq (AGLT) on 5 Nov 2026.
Strategic buyers lead exits
AeroVironment paid $4.1B for BlueHalo; Mobileye paid $900M for Mentee.
Failure is real
K-Scale shut in Nov 2025 with about $400,000; hardware margins run in the teens to twenties.
The physical AI investment landscape
Why now, capital flows and valuations, where the gaps are, business models, exits and m&a, common failure modes.
Why now
Capital, installed robots, compute and labor: four forces behind the surge.
Capital has arrived in robotics.
9
Compute spending is the largest capital wave.
12
Factories installed a record 603,000 robots.
10
Factory and warehouse labor is short.
13
Service robots grew 24% in 2025.
11
Defense and dual-use set the pace.
14
Capital has arrived in robotics.
Venture funding to robotics startups, global (Crunchbase).
$27B+
Raised by robotics startups in Jan–Sep 2026, above any prior full year
~$15B
Raised in full-year 2025, the previous record
$14.1B
Raised in 2021, the earlier peak
40%+
Share of 2025 robotics funding that went to ten companies (to Sep 2025)
- 2026 passed all of 2025 before midyear.
- Rounds are larger: ten companies took over 40% of 2025 funding.
- Humanoids, robot intelligence and defense autonomy lead.
What it shows
- A few mega-rounds set prices for the whole sector.
- The middle of the market is under-covered.
- Diligence matters more as prices rise.
What it means for you
Capital is arriving faster than proof of deployment, which is the case for diligence.
Factories installed a record 603,000 robots.
Industrial robot installations and forecast.
603K
Industrial robots installed in 2025, up 11%
5.08M
Robots at work in factories, up 9%
655K
Forecast installations for 2026
806K
Forecast installations for 2029
- China installed 354,000, 59% of the world.
- The U.S. installed 38,400 and passed Japan to rank second.
- The EU installed 60,500, down 11%.
Where demand sits
- The installed base keeps growing, about 7% a year to 2029.
- General-purpose physical AI is not yet industry-grade; arms and mobile robots earn today.
- Service and upgrade work follows the installed base.
What it means for you
Proven robots already sell in the hundreds of thousands; new classes must still earn their place.
Service robots grew 24% in 2025.
Professional service robot shipments, global.
~250K
Professional service robots shipped in 2025
117K
Transport and logistics robots, the top application
+24%
Growth in professional service robot shipments
~7,000
Full-size professional humanoids sold in 2025 (IFR)
- Logistics leads; hospitality and cleaning rank next.
- Robots as a service is gaining ground and is the common model in the U.S.
- Humanoids are the newest market and still small.
Reading the data
- Service operators already buy robots at scale.
- Humanoid volumes are bets on the next stage.
- Buyers want outcomes, so pay-per-use contracts grow.
What it means for you
Wheeled service robots are the volume today; humanoids are an option on tomorrow.
Compute spending is the largest capital wave.
Planned 2026 capital spending, four largest hyperscalers.
| Company | 2026 capital spending outlook | Note |
|---|---|---|
| Amazon | about $220B | Q3 purchases of property and equipment: $77.3B |
| Alphabet | $195B to $205B | Raised in July from $180B to $190B |
| Microsoft | about $170B | Trimmed from $175B in Oct 2026 |
| Meta | $135B to $145B | Low end raised in Oct; equity raise launched |
| Four companies | More than $720B | Against about $450B spent in 2025 |
What it means for physical AI
- Data centers need power, cooling and construction labor at record scale, which opens work for machines.
- Spending is shifting to debt and equity: Alphabet’s free cash flow was negative $9.1B in Q3 2026.
The largest capital wave in technology is building physical sites, and sites need physical AI.
Factory and warehouse labor is short.
Labor supply and cost, and the largest robot fleet.
584K
Open U.S. manufacturing jobs, Sep 2026
$48.62
Pay and benefits per hour worked in manufacturing, Jun 2026
12.7M
U.S. manufacturing workers, Sep 2026
1M+
Robots operating in Amazon facilities
- Jobs sit open while pay and benefits climb.
- Labor is the cost line that machines replace first.
- Payback depends on the wage and on hours the robot works.
The labor gap
- More than 1M robots across 300+ sites since July 2025.
- Its newest sites need 30% more reliability, maintenance and engineering staff.
- People move from carrying to supervising and repairing.
Amazon as proof
Labor scarcity is the demand engine; utilization decides who profits from it.
Defense and dual-use set the pace.
Funding and valuations in autonomous systems.
$8.5B
Defense tech venture funding in 2025, an all-time high
2x
More than double the 2024 total
$61B
Anduril valuation after its May 2026 round
$5B
Anduril Series H, May 2026, the largest round listed here
| Company | What it builds | Latest round | Valuation |
|---|---|---|---|
| Anduril | Autonomous systems and drones | $5B Series H, May 2026 | $61B |
| Saronic | Autonomous vessels | $1.75B Series D, Mar 2026 | $9.25B |
| Skydio | Enterprise and government drones | $110M Series F, Apr 2026 | $4.4B |
Autonomy with a government customer draws the largest private rounds in physical AI.
Capital flows and valuations
How much was raised, who took it and what it was priced against.
Funding has passed every prior year.
16
Capital is concentrated in few deals.
18
A few mega-rounds set the price.
17
Valuation is running ahead of revenue.
19
Funding has passed every prior year.
Robotics startup venture funding, global (Crunchbase).
| Period | Funding | What it shows |
|---|---|---|
| 2021 | $14.1B | The earlier peak, set in the 2021 venture boom |
| 2025 | about $15B | A new record, up about 70% on 2024 |
| Jan–Sep 2026 | $27B+ | Above any prior full year; Q3 alone was $9.9B, against $4.3B a year earlier |
How to read the numbers
- One tracker is used throughout this primer, so years compare like for like.
- Wider definitions that add AI software report larger totals; all show the same rise and the same concentration.
- Atomgigs builds company lists by use case and proof level, not by tracker label.
By September, 2026 had passed every earlier year; a few large rounds account for much of it.
A few mega-rounds set the price.
Selected rounds, 2025 and 2026.
| Company | Segment | Round | Valuation | Date |
|---|---|---|---|---|
| Figure AI | Humanoids | $1B+ Series C | $39B | Sep 2025 |
| Skild AI | Robot intelligence | $1.4B | $14B | Jan 2026 |
| Anduril | Autonomous defense systems | $5B Series H | $61B | May 2026 |
| Saronic | Autonomous vessels | $1.75B Series D | $9.25B | Mar 2026 |
| Apptronik | Humanoids | $520M extension, $935M Series A in all | $5B+ | Feb 2026 |
| Skydio | Drones | $110M Series F | $4.4B | Apr 2026 |
These rounds set the reference prices that the rest of the sector is measured against.
Capital is concentrated in few deals.
Global venture funding, 2025.
$469B
Global venture funding in 2025, up 47%
48%
Share that went to AI companies, a record
65%
Share of all funding taken by mega-rounds
738
Mega-rounds of $100M or more in 2025
- Robotics startups took about $15B in 2025 and $27B+ in Jan–Sep 2026.
- Ten robotics companies took over 40% of funding to Sep 2025.
- Venture deal counts fell 17% while totals rose.
Where this leaves robotics
- Seed to Series B companies with field proof.
- Services, integration and operations businesses.
- Component and supply chain makers.
Where capital is thinner
A crowded top and a thin middle: the case for looking beyond the headline names.
Valuation is running ahead of revenue.
Price against revenue in three transactions.
| Company | Event | Value | Revenue signal |
|---|---|---|---|
| Agility Robotics | SPAC; listed Nov 2026 | $2.5B pre-money | $1.8M revenue; Digit at 9 sites |
| Symbotic | Public company, Nasdaq | Listed | $721M in Q3 FY2026; $22.5B backlog |
| ABB Robotics | Agreed sale to SoftBank, Oct 2025 | $5.375B enterprise value | $2.3B revenue in 2024 |
| The comparison | |||
- A mature robot maker with $2.3B revenue was priced at about 2.3 times sales; a humanoid maker with $1.8M revenue priced at $2.5B.
- Prices reflect the option on future scale. Diligence turns that option into numbers: units, utilization, margin.
Investors underwrite deployments and unit economics, not the demo.
Where the gaps are
Segments, geography and proof levels: where capital is thin.
Where capital goes, and where it does not.
21
Demand is concentrated in Asia.
23
Four gaps worth a closer look.
22
How proven is each machine?
24
Where capital goes, and where it does not.
Atomgigs view of capital and proof by segment.
| Segment | Capital | Proof | Atomgigs view |
|---|---|---|---|
| Robot intelligence (models) | Very high | Early | Few winners; hard to diligence from outside |
| Humanoids | Very high | Pilot | Heavy burn and small revenue; timing is the risk |
| Defense autonomy | Very high | Commercial | Government demand; scale is real |
| Warehouse and logistics | High | Commercial | Proven; consolidation and RaaS economics |
| Industrial arms | Mature | Commercial | China-led; price pressure |
| Construction and infrastructure | Low | Early | Thin capital for site machines and services |
| Operations and integration | Low | Early | Where deployment succeeds or fails |
| Components and supply chain | Medium | Commercial | Actuators, sensors, batteries: margin sits here |
The least capital sits where deployment is hardest: sites, services and people.
Four gaps worth a closer look.
Where Atomgigs sees thin capital and real demand.
- 1Deployment and integration
Most robots fail between purchase and daily use. Integrators and operators are scarce. Few venture-backed pure plays.
- 2Field operations
Uptime, repair and remote supervision recur. Revenue scales with the installed base. Needs trained technicians.
- 3Components
Actuators, sensors, batteries and chips. Much of the supply base sits in Asia. Tariffs and export rules change cost.
- 4Site machines
Machines for construction, data center and infrastructure sites. Harsh, changing environments. Few funded makers; a large buyer base.
Each gap is where Atomgigs works every day: deployment, operations, people and sites.
Demand is concentrated in Asia.
Industrial robot installations by region, 2025.
76%
Share of 2025 installs in Asia (457,315 robots)
59%
Share of 2025 installs in China (354,000)
38,400
U.S. installs in 2025, up 12%, now second
60,500
EU installs in 2025, down 11%
- Chinese makers sold 57% of robots in China in 2024, up from about 28% a decade earlier.
- Western makers tend to win on software, safety record and service.
- U.S. and EU buyers add demand for local integration.
Demand
- The U.S. leads venture funding for humanoids and robot intelligence.
- China leads installs and now lists robot makers at home.
- EU installs fell 11%; Germany, the largest EU market, fell 8%.
Capital
Demand is in Asia and the largest private checks are in the U.S.; both shape the market.
How proven is each machine?
Proof levels used throughout the Atomgigs primers.
| Machine or use case | Proof | Evidence |
|---|---|---|
| Industrial arms in factories | Commercial | 603,307 installed worldwide in 2025 |
| Warehouse mobile robots and storage systems | Commercial | Amazon runs over 1M; Symbotic has 77 systems in deployment |
| Professional cleaning and delivery robots | Commercial | Service robot shipments of about 250,000 in 2025 |
| Inspection and survey drones | Commercial | Routine use under existing FAA rules |
| Construction layout and drilling robots | Early commercial | Growing use on large projects; few makers at scale |
| Humanoids in logistics and factories | Pilot | Digit at 9 customer sites; about 7,000 full-size units sold in 2025 (IFR) |
| General-purpose humanoids at home | Concept | Early demonstrations and pre-orders only |
Investors weigh proof level: commercial earns revenue today; pilot earns an option.
Business models
Hardware, robots as a service, services and software, and what drives returns.
Four ways robot companies earn money.
26
Mature automation builds margin slowly.
29
Robots as a service sells labor by the hour.
27
The intelligence layer is a separate bet.
30
Utilization decides who wins.
28
The service burden lands on people.
31
Four ways robot companies earn money.
The revenue lines investors will meet.
- 1Hardware sales
Machines sold or leased. Margin set by the bill of materials. Lumpy revenue; heavy working capital.
- 2Robots as a service
Monthly, per-hour or per-task fees. No capital outlay for the buyer. The maker carries utilization risk.
- 3Services attach
Install, maintain, train and operate. Recurring and sticky. Grows with the installed base.
- 4Software and data
Fleet control, models and analytics. Highest margin once proven. Needs a large fleet to pay.
Look for companies where recurring lines grow faster than one-time hardware sales.
Robots as a service sells labor by the hour.
Four common pricing patterns.
| Pattern | How it is priced | Works best when |
|---|---|---|
| Monthly per robot | Flat fee per robot | Workloads are steady and utilization is high |
| Per hour | Fee per operating hour | Demand varies by shift or season |
| Per task | Per pick, tote or pallet | Output is easy to measure |
| Hybrid | Base fee plus usage | Buyer and maker share the risk |
A live example
- Agility Robotics reports about $300M in potential multi-year contract value for Digit under robots-as-a-service terms.
- RaaS moves utilization risk from the buyer to the maker, and so to the investor.
RaaS turns a capital sale into a long-dated contract that must be underwritten like a lease.
Utilization decides who wins.
The arithmetic behind robots as a service. Typical ballpark values, not quotes.
1,500 h
Break-even hours a year in the illustration
4,000 h
Hours in a two-shift year (8 h x 2 x 250 days)
38%
Utilization needed on two shifts in the illustration
60–70%
Break-even utilization cited for a robot costing about $2 an hour
- Break-even hours = robot cost per year ÷ loaded wage per hour.
- Illustration: $60,000 a year ÷ $40 an hour = 1,500 hours.
- Across 4,000 hours, the robot must work 38% of the time.
The break-even test
- One analysis finds a robot at about $2 an hour beats U.S. warehouse wages only above 60–70% utilization.
- Productivity per hour improves with software; cost per hour improves only with hours run.
What the market shows
Ask every company for measured utilization by site, not capacity on paper.
Mature automation builds margin slowly.
Symbotic, a leading U.S.-listed warehouse automation company.
$721M
Symbotic revenue, fiscal Q3 2026, up 22%
$22.5B
Symbotic backlog, fiscal Q3 2026
21.2%
Gross margin, fiscal Q1 2026, up from 16.6%
25%
Adjusted gross margin, fiscal Q3 2026
- Systems revenue grew 20% to $671M.
- Software revenue grew 57% and operations services 49%.
- 77 systems are in deployment.
What is working
- Systems were 94% of fiscal 2025 revenue.
- Walmart is a large share of revenue.
- Projects take about two years from announcement to completion.
What to watch
Even a leader in warehouse automation earns most of its revenue from one-time systems.
The intelligence layer is a separate bet.
Four layers of the physical AI stack.
- 1Body makers
Humanoids, arms, drones, vehicles. Capital-heavy; thin margins. Examples: Figure, Apptronik, Agility.
- 2Brain makers
Robot foundation models. Skild AI raised $1.4B at $14B. Physical Intelligence builds models, not bodies.
- 3Fleet software
Orchestration, simulation and digital twins. Amazon’s DeepFleet cut fleet travel time about 10%. Platform play with network effects.
- 4Integrators and operators
Install, tune and run the fleet. Where pilots become production. Few funded specialists.
Where value settles is not yet clear, so investors judge each layer on its own evidence.
The service burden lands on people.
What it takes to keep robots working.
- Site survey and layout.
- Integration with warehouse or building systems.
- Training, safety sign-off and change management.
- Maintenance, spares and remote support.
What deployment needs
- Its newest sites need 30% more staff in reliability, maintenance and engineering.
- People move from carrying to supervising and repairing.
- Each robot has a human manager behind it.
What Amazon reports
The people layer is a cost line and a revenue line; both belong in the model.
Exits and M&A
Listings, strategic sales and the buyers consolidating the sector.
Four ways investors get paid.
33
Exit activity is accelerating.
36
Two listings, two tests.
34
What strategic buyers pay for.
37
Strategic buyers are consolidating.
35
Four ways investors get paid.
Exit routes with 2025 and 2026 examples.
Route
Recent example
What it needs
IPO
Unitree on the STAR Market, 19 Aug 2026
A market that rewards scale and growth
| SPAC | Agility Robotics via Churchill Capital XI; on Nasdaq (AGLT) since 5 Nov 2026 | Public-company reporting; about $465M gross proceeds |
|---|---|---|
| Strategic sale | SoftBank and ABB Robotics, $5.375B; blocked by China in Nov 2026 | A buyer with a platform thesis and regulatory clearance |
| Tuck-in acquisition | Mobileye buying Mentee Robotics, $900M | Technology a larger firm lacks |
Four routes are open today; strategic sales have the longest record.
Two listings, two tests.
The first pure-play humanoid listings.
- Listed on Shanghai’s STAR Market on 19 August 2026.
- Priced at about $9B; closed 460% above the offer on day one.
- Shares then fell back as investors asked for deliveries and earnings.
Unitree: the full IPO
- Merger with Churchill Capital XI at $2.5B pre-money; about $465M gross proceeds.
- Reported $1.8M revenue, with Digit at 9 customer sites.
- Began trading on Nasdaq as AGLT on 5 Nov 2026.
Agility: the SPAC
Public markets pay for scale in robots, then check for deliveries and earnings.
Strategic buyers are consolidating.
Selected acquirers and what they bought.
| Buyer | Move | Logic |
|---|---|---|
| SoftBank | ABB Robotics deal ($5.375B) blocked by China, Nov 2026; stakes in Skild AI, AutoStore | Join AI models to robot hardware |
| Amazon | Kiva Systems in 2012 ($775M); RIVR doorstep robots | Own the warehouse and delivery stack |
| Hyundai | Owns Boston Dynamics | Industrial and mobility use |
| Mobileye | Mentee Robotics, $900M | Extend vehicle AI to humanoids |
| Archer | Wisk Aero, Insitu and SkyGrid from Boeing; signed Aug 2026, pending | Combine eVTOL and drone businesses |
| AeroVironment | BlueHalo, $4.1B | Broaden defense autonomy |
Strategic buyers with a platform thesis are the most active acquirers.
Exit activity is accelerating.
Milestones in robotics exits, 2012 to 2026.
- 12012
Amazon buys Kiva Systems for $775M. Warehouse robots become a core asset.
- 2Oct 2025
SoftBank agrees to buy ABB Robotics for $5.375B. Blocked by China’s security review in Nov 2026.
- 3Jan 2026
Mobileye announces Mentee Robotics for $900M.
- 4Jun 2026
Agility Robotics agrees a $2.5B SPAC; listed on Nasdaq in Nov 2026.
- 5Aug 2026
Unitree lists on the STAR Market. Archer signs for Boeing’s Wisk, Insitu and SkyGrid.
Exit activity is accelerating, with three of the five events in the last twelve months.
What strategic buyers pay for.
The ABB Robotics deal and the traits buyers look for.
$5.375B
Agreed enterprise value, SoftBank and ABB Robotics
$2.3B
ABB Robotics revenue in 2024
12.1%
ABB Robotics operating EBITA margin, 2024
~7,000
ABB Robotics employees
- Machines running at paying customers.
- Utilization and uptime data.
Deployments
- Service, software and RaaS contracts.
- Backlog with clear conversion.
Recurring revenue
- Technology or customers the buyer lacks.
- A team able to operate at scale.
Strategic fit
Buyers pay for installed, earning machines and the teams that run them.
Common failure modes
Eight ways physical AI investments go wrong, with real cases.
Eight ways investments fail.
39
Hardware margins are thin.
42
Failures are real and recent.
40
Safety and regulation shape deployment.
43
From pilot to production: five gates.
41
Supply chain and tariffs raise cost.
44
Eight ways investments fail.
Failure modes and the diligence test for each.
| Failure mode | What it looks like | What to test |
|---|---|---|
| Pilot purgatory | Many pilots, few paid rollouts | Pilot-to-production conversion by customer |
| Hardware margins | Gross margin stuck in the teens | Bill of materials and margin by line |
| Integration cost | Services cost exceeds plan | Hours and cost per site |
| Low utilization | Robots idle on site | Measured hours run per robot |
| Safety and certification | Deployment halted or limited | Standards status and incident log |
| Supply chain and tariffs | Parts delayed or repriced | Source of actuators, sensors and chips |
| Customer concentration | One buyer is most of revenue | Revenue by customer and contract term |
| Capital intensity | Cash runs out before scale | Runway against the deployment plan |
Each failure mode maps to a diligence test; Part 3 turns them into a scorecard.
Failures are real and recent.
Four cases from 2024 and 2025.
Company
What happened
Lesson
K-Scale Labs
Shut down in Nov 2025 with about $400,000 in cash after shipping two K-Bot units; it found no lead investor for its Series A
Hardware takes more capital and time than the pitch assumes
| Rethink Robotics | Shut down a second time in 2025 after weak sales and investors pulling funds | A good product needs volume and funding |
|---|---|---|
| Embodied | Closed its companion robot business in Dec 2024 | Consumer robots need a lasting reason to buy |
| Cruise | GM ended funding for the robotaxi unit in December 2024 | Autonomy at scale burns capital for years |
Failure follows funding gaps and hardware reality, not only technology.
From pilot to production: five gates.
How to tell a pilot from a business.
- 1Pilot
Proves the task works. Metric: success rate.
- 2Extended pilot
Runs on real shifts. Metric: interventions per hour.
- 3First site
Paid and in daily use. Metric: uptime and utilization.
- 4Multi-site
Repeats at new sites. Metric: install time and cost.
- 5Fleet
Runs at scale with service. Metric: margin and payback.
Ask where each customer sits on the ladder; revenue starts at gate three.
Hardware margins are thin.
Margins at two scaled robot businesses.
| Company | Measure | Figure | Period |
|---|---|---|---|
| ABB Robotics | Operating EBITA margin | 12.1% | 2024 |
| Symbotic | Gross margin | 16.6% | Fiscal Q1 2025 |
| Symbotic | Gross margin | 21.2% | Fiscal Q1 2026 |
| Symbotic | Adjusted gross margin | 25.0% | Fiscal Q3 2026 |
What it means
- Symbotic gained 4.6 points of gross margin in a year, with a $22B backlog behind it.
- Early hardware makers with small volumes earn less.
- Margin expansion has to come from software and service lines.
Model hardware margins in the teens to twenties until volume and services prove otherwise.
Safety and regulation shape deployment.
The main standards and rules investors will meet.
| Standard or rule | Covers | Applies to |
|---|---|---|
| ISO 10218-1 and -2 | Safety of industrial robots and robot systems | Arms and cells |
| ANSI/A3 R15.06-2025 | U.S. adoption of the robot safety standard | U.S. robot cells |
| ISO 3691-4 | Driverless industrial trucks | Mobile robots and AGVs |
| ISO 13482 | Personal care robots | Service and care robots |
| FAA Part 107 | Small drone operations | Commercial drones |
| EU Machinery Regulation 2023/1230 | Machinery, including AI-based safety functions | EU sales; applies from 20 Jan 2027 |
Standards for humanoids and other dynamically stable robots are still being written.
Supply chain and tariffs raise cost.
Where robots and parts come from.
57%
Chinese makers’ share of robot sales in China, 2024
~28%
Their share about a decade earlier
59%
China’s share of 2025 global installs
- Chinese suppliers are taking share at home and expanding abroad.
- China installs more than half of the world’s industrial robots.
- Price pressure reaches Western makers.
What the data shows
- Where are actuators, sensors, batteries and chips made?
- How much of the bill of materials is exposed to tariffs or export rules?
- Is there a second source for each critical part?
What to ask
Supply chain is a margin question and a continuity question; diligence both.
Sector investment views
The sector map, robotics, OEMS, drones and VTOL, data centers, manufacturing and logistics, construction and infrastructure.
The sector map
Nine sectors side by side, and how to read each view.
Nine sectors, one map.
47
Every view follows five steps.
48
Nine sectors, one map.
Atomgigs focus areas and how investors can read them.
| Sector | Thesis | Proof today | Main risk |
|---|---|---|---|
| Robotics | Labor scarcity meets proven machines | Arms scaled; humanoids pilot | Price pressure and integration cost |
| OEMs, drones, VTOL | Five layers; makers consolidating | Drones commercial; VTOL early | Rules and certification |
| Data centers | Power-limited build-out, record demand | Operations robots early | Power delivery; debt-funded build |
| Manufacturing, logistics | Labor gap and RaaS economics | Storage and picking commercial | Long project cycles |
| Construction, infrastructure | Flat productivity, short labor | Drone survey commercial | Fragmented buyers |
| Public safety, defense | Large budgets, autonomy demand | Drone first responder commercial | Trust and procurement |
| Commercial services | Turnover-driven demand | Cleaning, delivery commercial | Thin operator margins |
| Channel | Contractors carry machines to projects | Contractor trials widespread | Contract terms and margin |
| Talent | Every robot needs a human manager | Pilot certification established | Wage inflation |
Proof differs by sector; commercial earners and options on what is next carry different risks.
Every view follows five steps.
How each sector section is organized.
- 1Thesis
Why the sector attracts capital now.
- 2Proof
What runs in paying use today, and what is still a pilot.
- 3Who is building
Named makers, operators and buyers.
- 4Risks
What has gone wrong, and what could.
- 5What to watch
Signals that would change the view.
Every sector view follows the same five steps, so views can be compared side by side.
Robotics
Arms, mobile robots, storage systems and humanoids.
Robots earn today in factories and warehouses.
50
Robotics in the field.
52
Four tiers of proof in robotics.
51
Robots earn today in factories and warehouses.
Robotics: thesis and evidence.
5.08M
Robots at work in factories
603K
Installed in 2025, a record
59%
China’s share of 2025 installs
~7,000
Full-size humanoids sold in 2025 (IFR)
- The installed base grows about 7% a year to 2029.
- Labor is scarce and robots are proven in factories and warehouses.
- Value is moving from the arm to software, service and fleets.
Thesis
- Hardware is about half the deployed cost of a mobile robot system.
- Integration, tooling and safety usually cost more than the arm.
- Chinese makers sell more than half of the robots in China.
Evidence
Robots that earn today carry the evidence; humanoids are still options. Go deeper: Primer 01 Robotics.
Four tiers of proof in robotics.
Who is building, how proven, risks and signals.
- 1Who is building
Arms: ABB Robotics, FANUC, Yaskawa, KUKA, Universal Robots Storage: Symbotic, AutoStore, Geekplus Humanoids: Agility, Figure, Apptronik, Unitree
- 2How proven
Arms: scaled Storage and picking: commercial Forklifts and unloading: early Humanoids: pilot
- 3Main risks
Price pressure from China Integration cost Thin hardware margins Customer concentration
- 4What to watch
Paid humanoid sites beyond Agility Fleet software revenue Ownership changes among forklift makers Measured utilization
Investors weigh proof level: scaled and commercial earn revenue; pilot earns an option.
Robotics in the field.
Representative machines and sites.
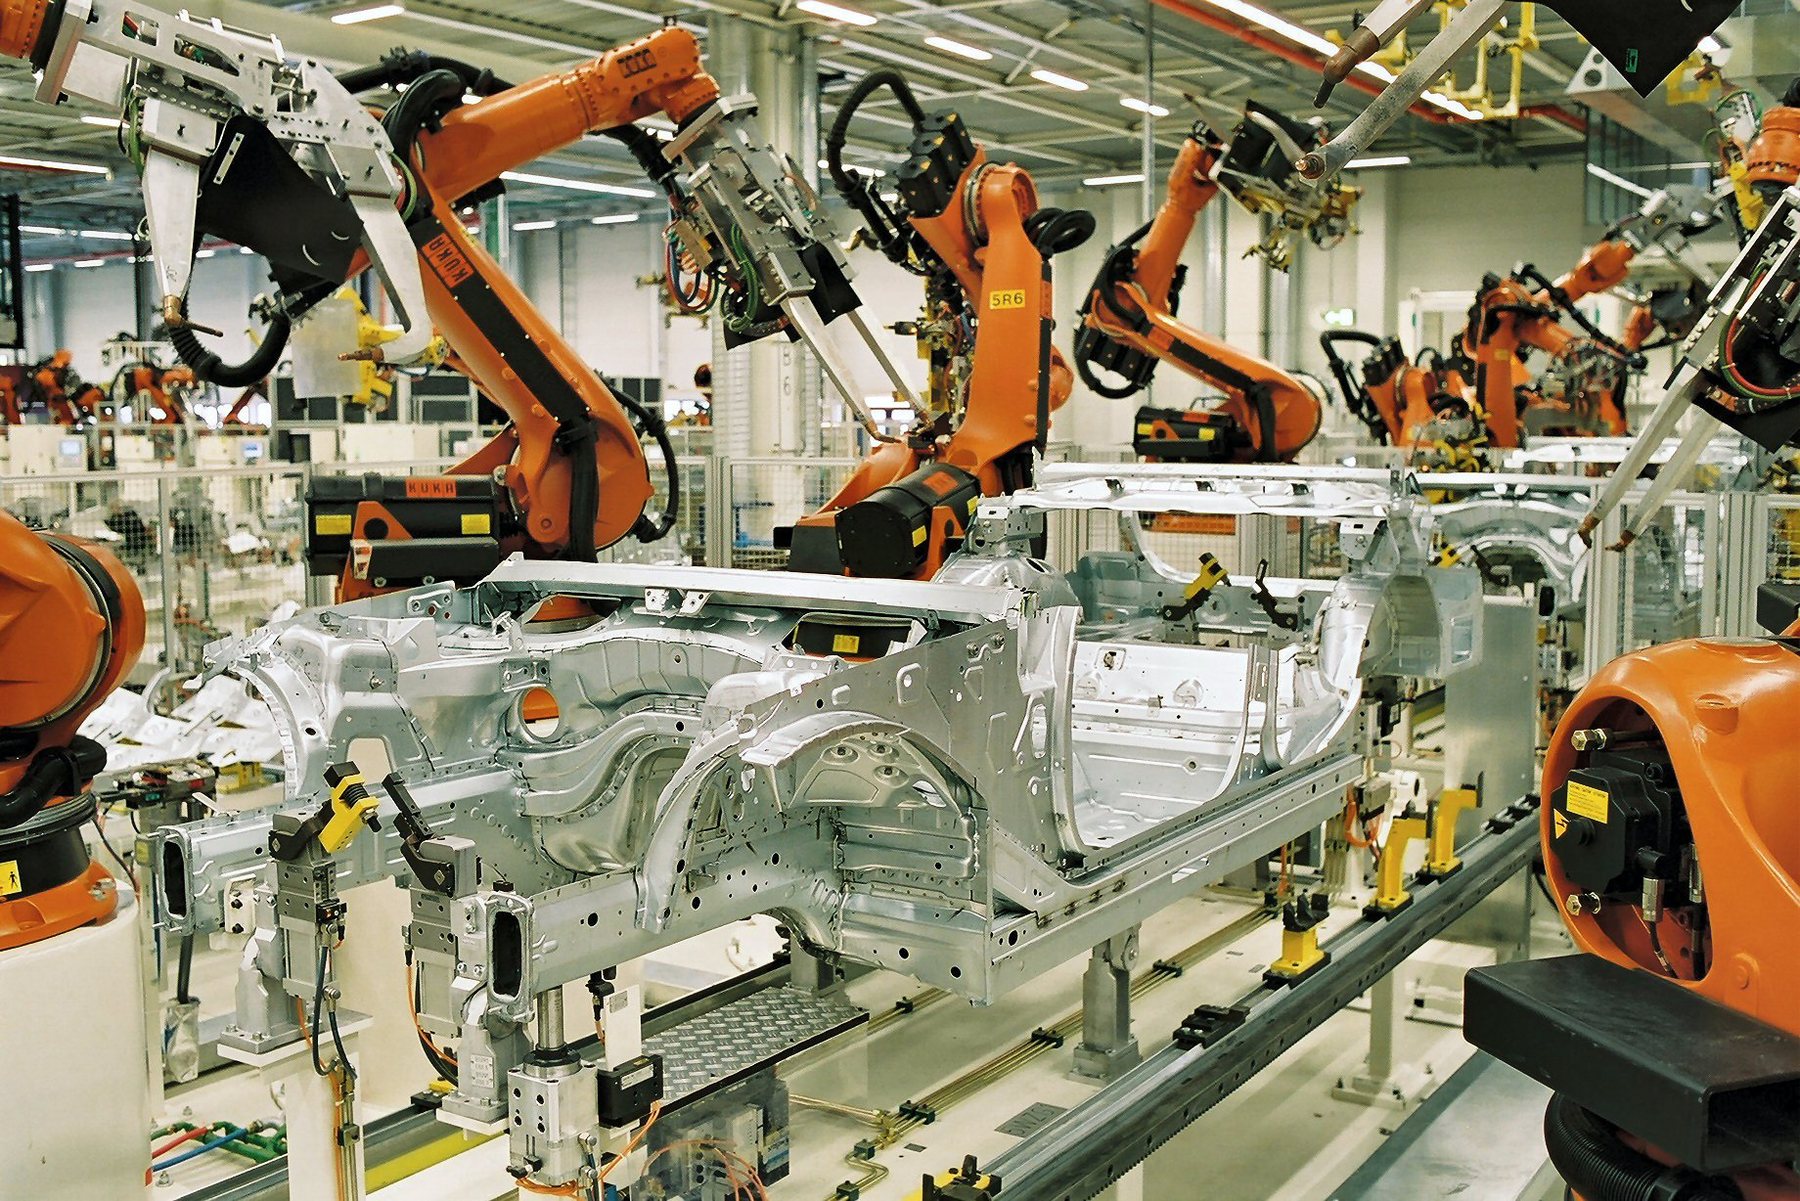
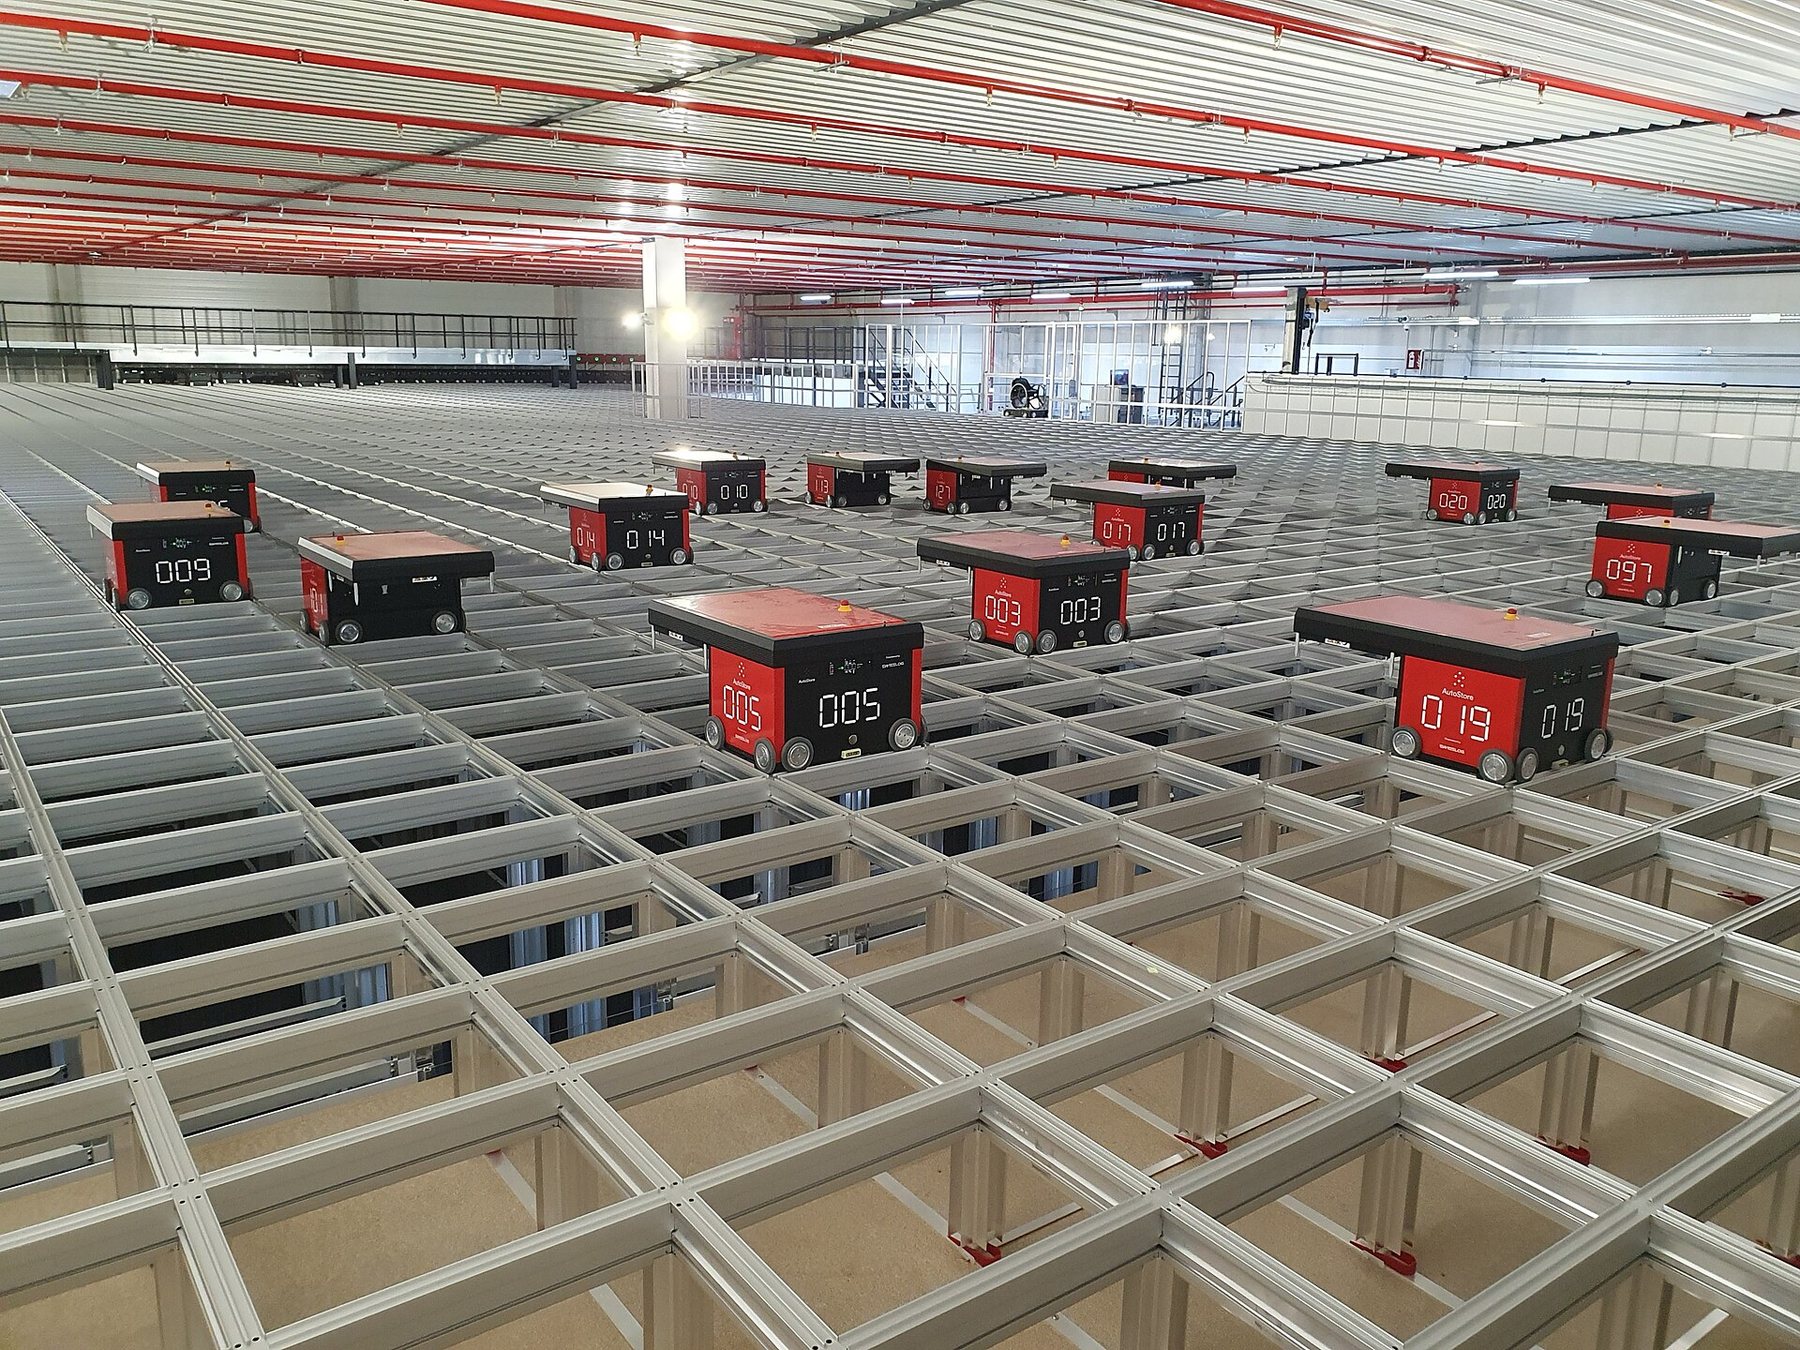
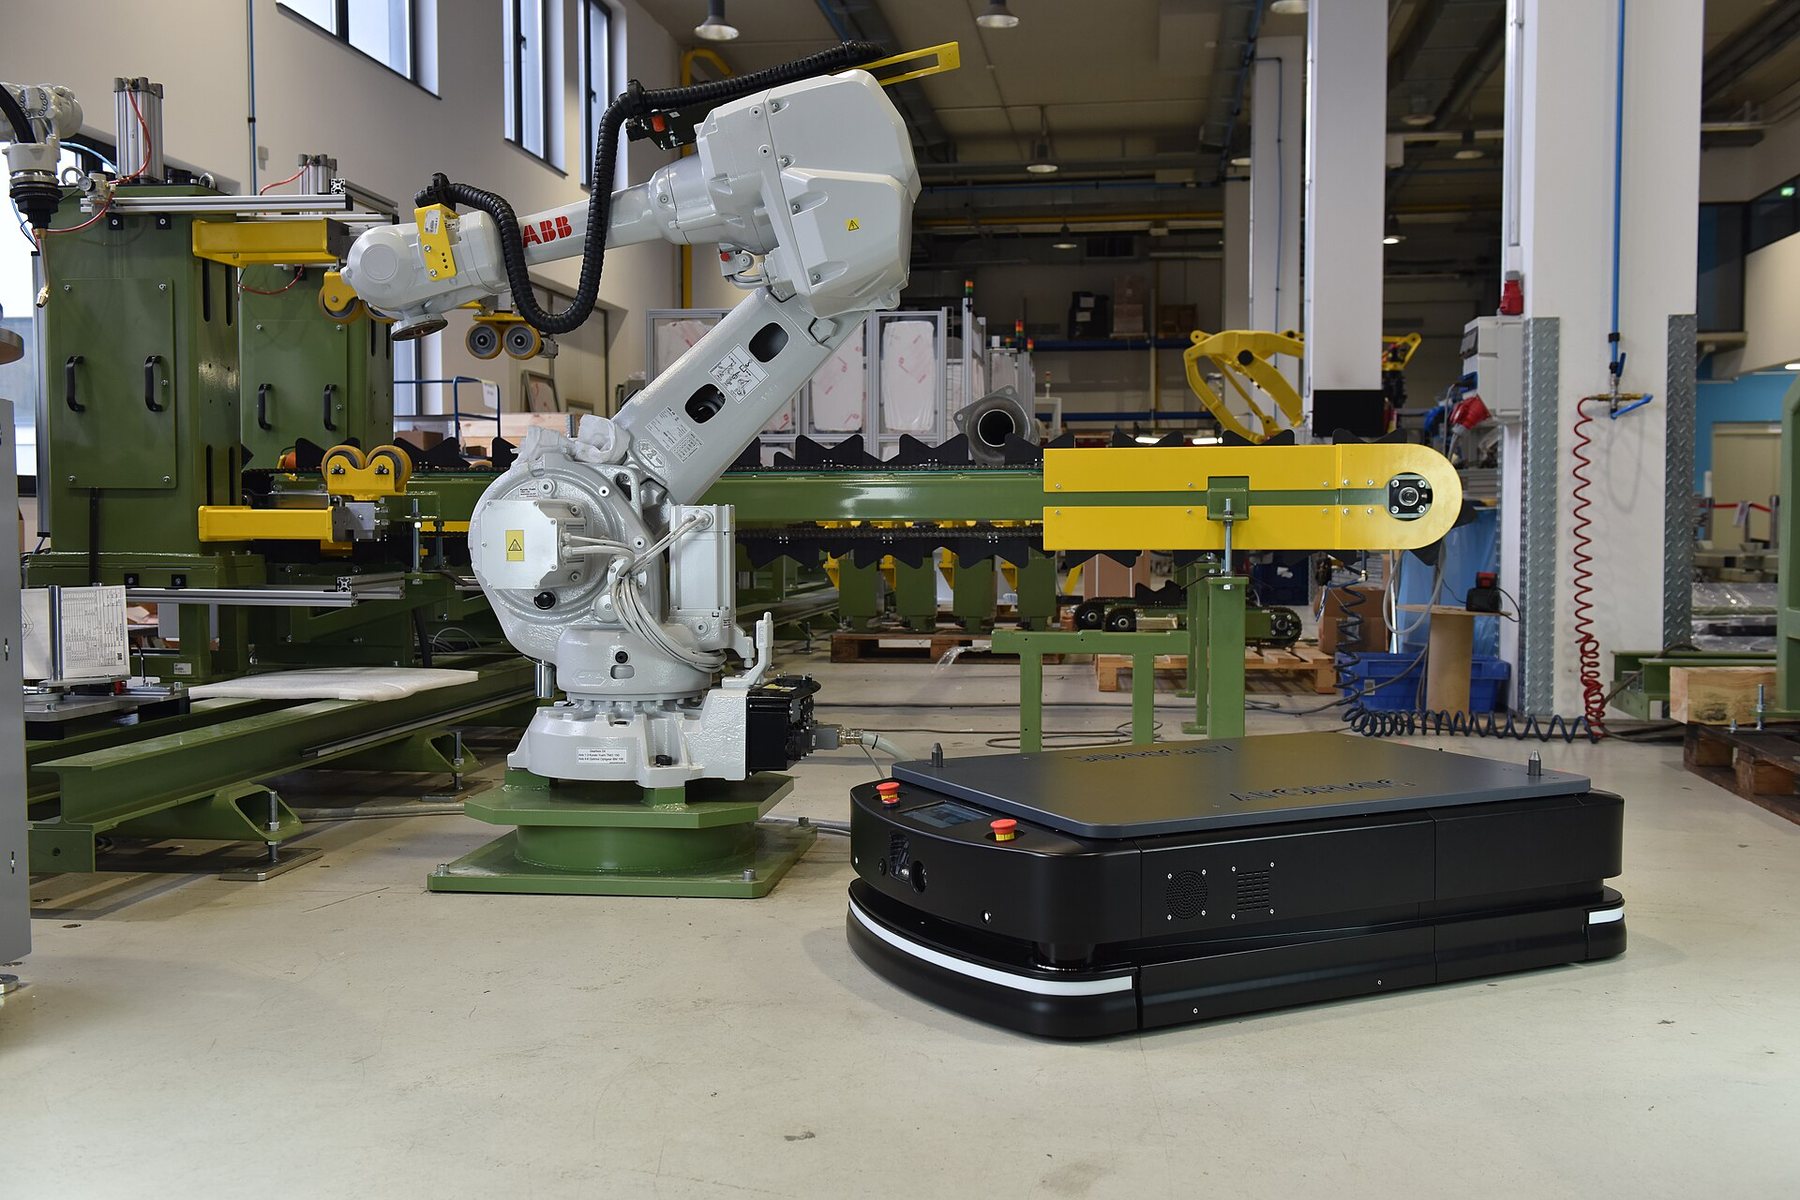
Proven machines earn revenue today; new forms are options.
OEMs, drones and VTOL
The non-robot machines and the five layers that make them work.
Drones are commercial; the stack is the opportunity.
54
Drones and VTOL in the field.
56
Drones lead; passenger VTOL still has gates to pass.
55
Drones are commercial; the stack is the opportunity.
OEMs, drones and VTOL: thesis and evidence.
$44.4B
Civil drone market, 2026
490K+
FAA-certificated remote (drone) pilots, end-2025
21.1B
Connected IoT devices, end of 2025
$324B
Enterprise IoT market, 2025
- Five layers turn a machine into finished work: sense, connect, decide, act, twin.
- Most makers sell one layer; projects need all five.
- Drones are commercial for inspection, survey and public safety.
Thesis
- Consolidation has begun: AeroVironment bought BlueHalo for $4.1B; Archer signed for Boeing’s Wisk, Insitu and SkyGrid.
- Skydio is valued at $4.4B and Anduril at $61B.
- U.S. rules now bar new foreign-made drones.
Evidence
Finished work comes from joining the layers; look for makers that partner across them. Go deeper: Primer 02 OEMs, Drones and VTOL.
Drones lead; passenger VTOL still has gates to pass.
Who is building, how proven, risks and signals.
- 1Who is building
Drones: Skydio, Anduril, DJI VTOL: Joby, Archer Sensors and IoT: many specialist makers
- 2How proven
Inspection and survey drones: commercial Dock-based drones: early commercial Passenger VTOL: early; certification in progress
- 3Main risks
Foreign-made drone rules Certification time for VTOL Fragmented IoT makers Airspace rules
- 4What to watch
Beyond-line-of-sight rules Dock-and-drone contracts Further consolidation Defense orders
Investors look for drone makers with recurring service revenue and a clear path through the rules.
Drones and VTOL in the field.
Representative machines and sites.
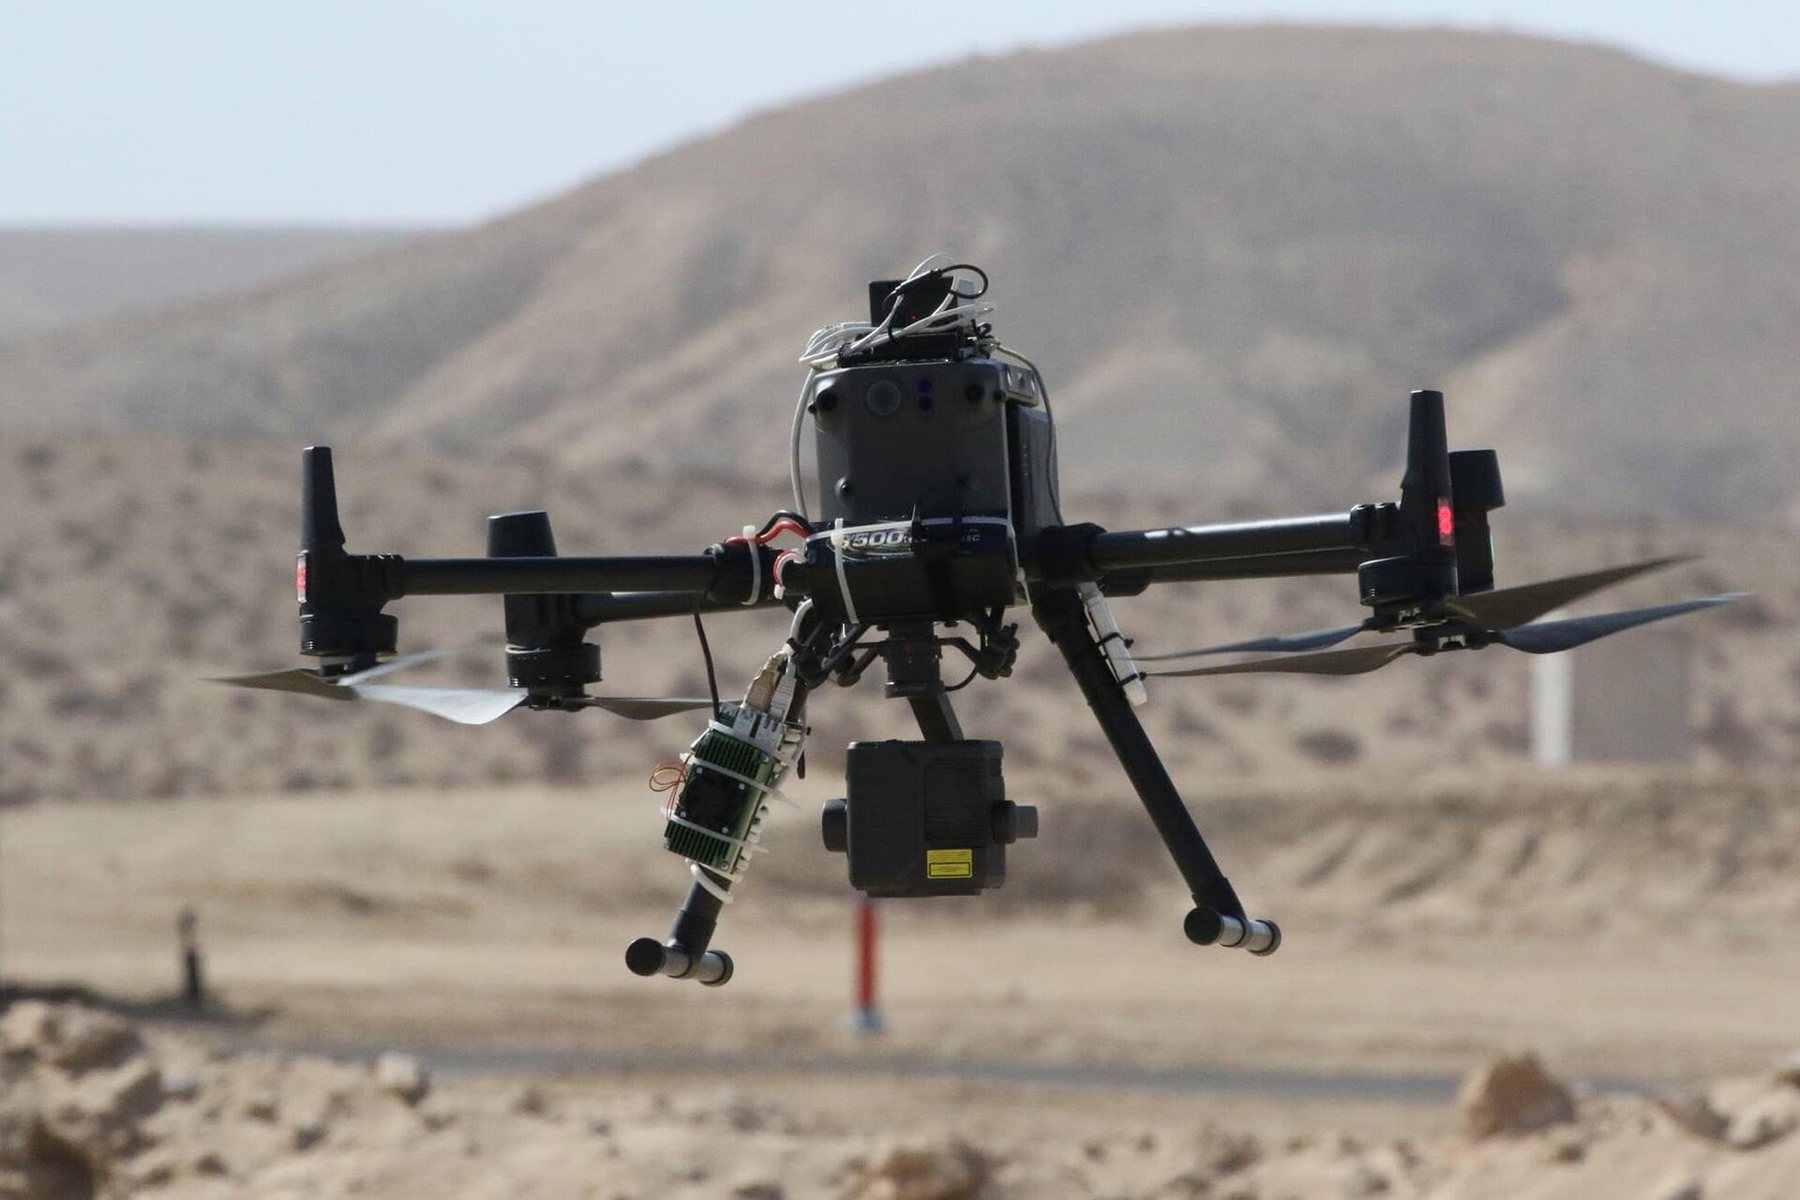
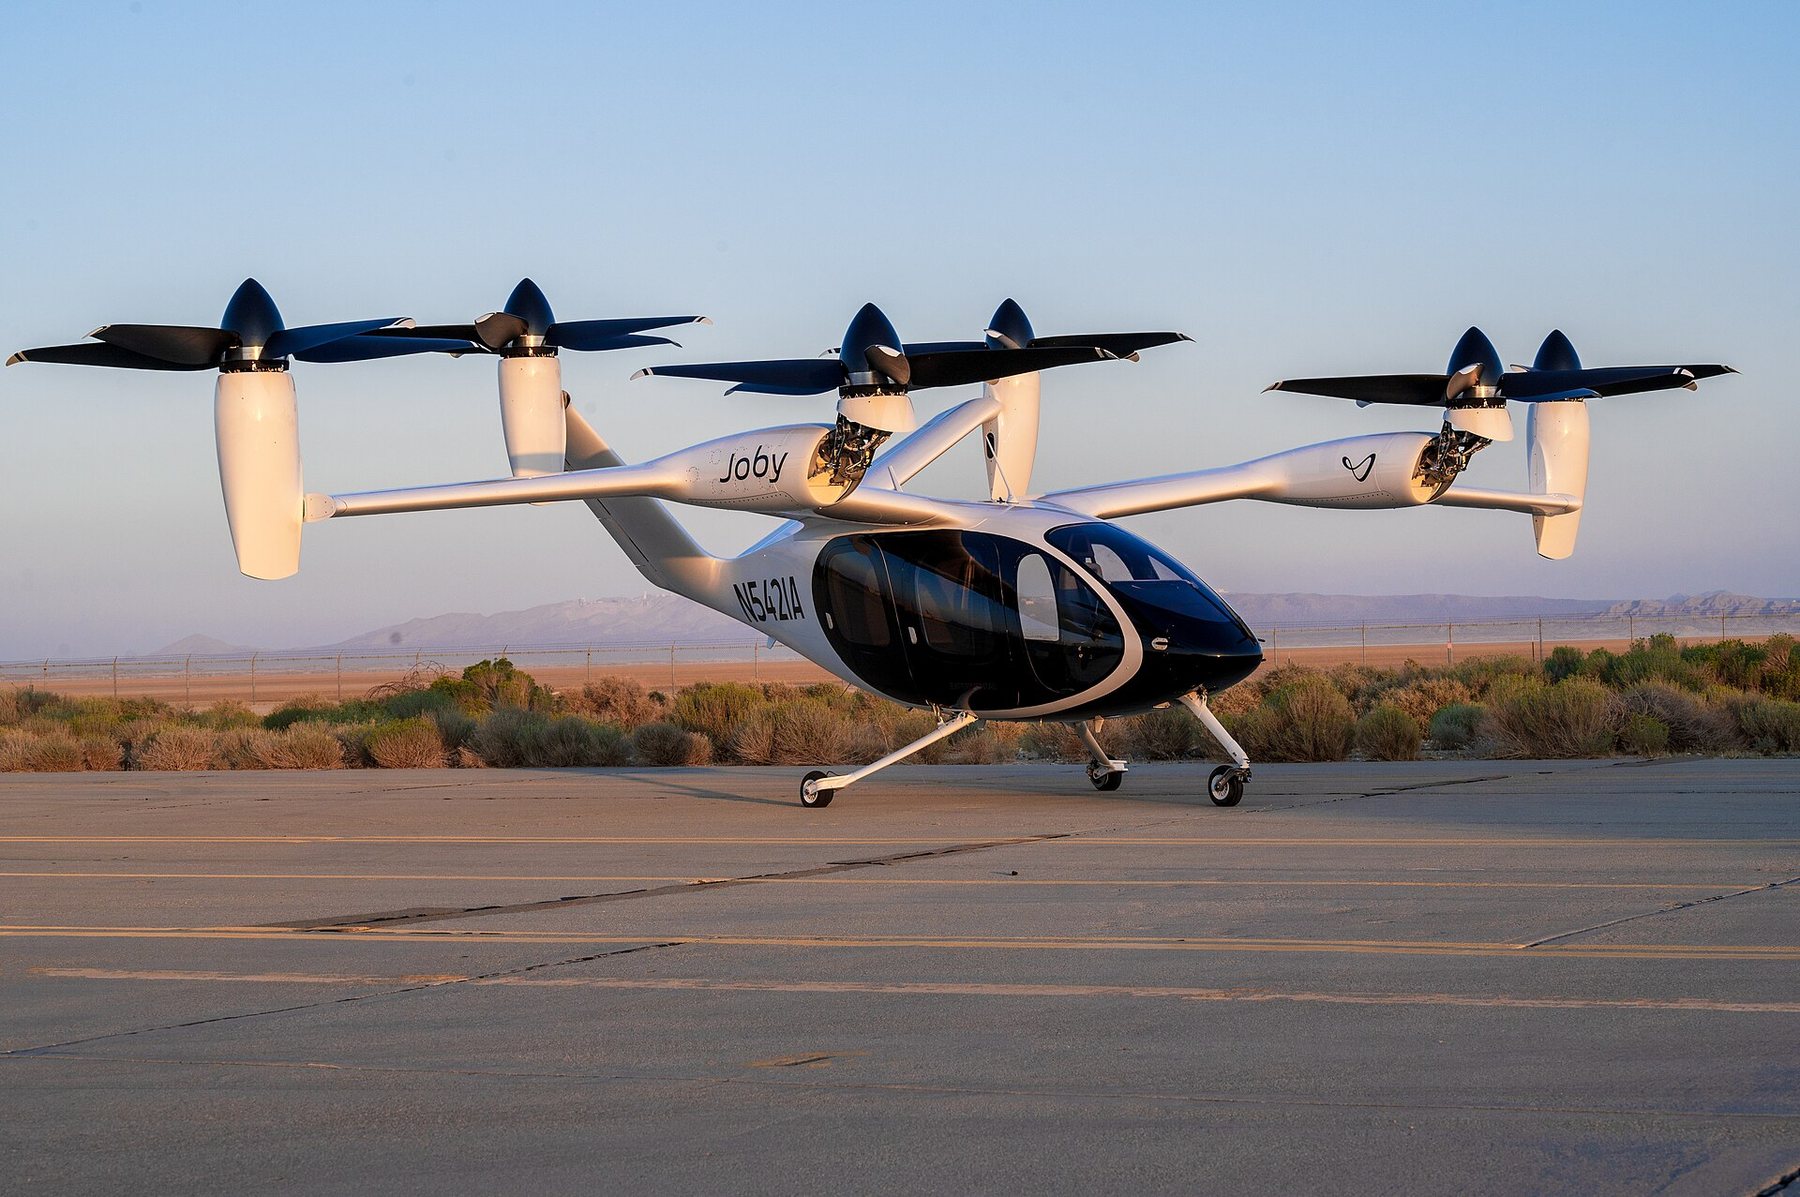

Drones earn now; passenger aircraft must still clear the gates.
Data centers
The largest capital program in corporate history, and what it needs on the ground.
Data centers are the largest capital program in tech.
58
Data center sites.
60
Hyperscalers build, operators lease, funds own.
59
Data centers are the largest capital program in tech.
Data centers: thesis and evidence.
$720B+
Four hyperscalers’ 2026 capex outlook
1.4%
Record-low vacancy, primary markets, H1 2026
80.4%
Of capacity under construction already preleased
~$11M
Building cost per MW, before IT
- Supply grew 33.7% in a year and vacancy still fell.
- Power, not land, is the constraint on new capacity.
- About 20% of spend goes to buildings, power and cooling; 80% to chips, servers and networks.
Thesis
- U.S. data centers could use about 12% of national electricity by 2030 (LBNL), up from 4–5% in 2024.
- Hyperscalers are raising debt and equity: capex now outruns cash flow.
- California now makes data centers pay their own grid costs.
Evidence
Demand is secured by leases; delivery is limited by power, labor and time. Go deeper: Primer 07 Data Centers.
Hyperscalers build, operators lease, funds own.
Who is building, how proven, risks and signals.
- 1Who is building
Hyperscalers: 28 GW of self-build under construction Operators and colocation: lease capacity Funds: own and finance the assets
- 2How proven
Site build: 2 to 4 years from site to live capacity Inspection, patrol and cable work robots: pilot to early commercial Liquid cooling is spreading as chips run hotter
- 3Main risks
Power delivery delays Tenant concentration Debt-funded build Local ratepayer rules
- 4What to watch
Power-ready sites Preleasing rates Liquid cooling adoption Utility tariffs
Physical AI helps build and run sites faster; the investment case rests on power and tenants.
Data center sites.
Representative machines and sites.

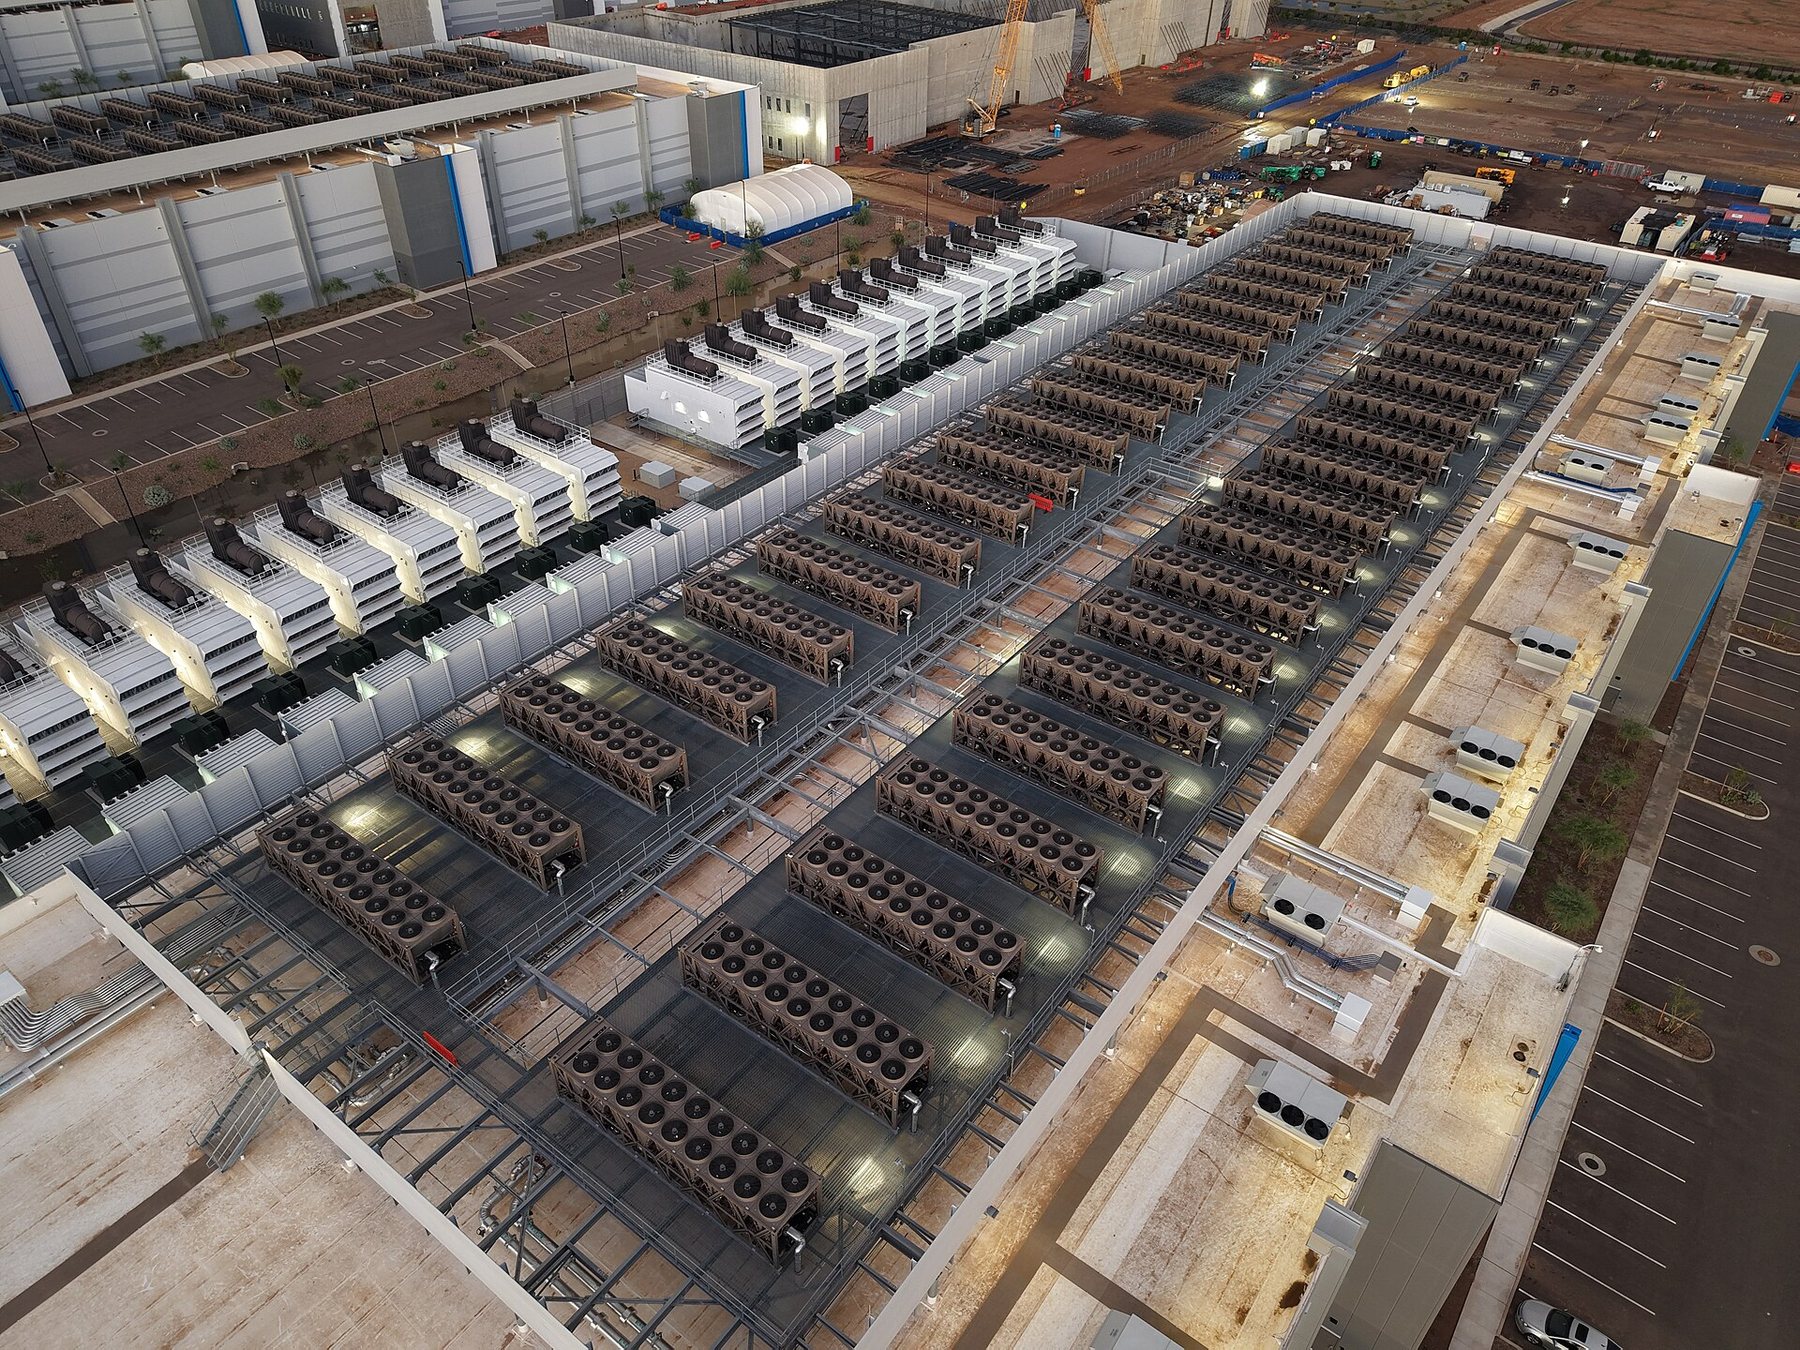
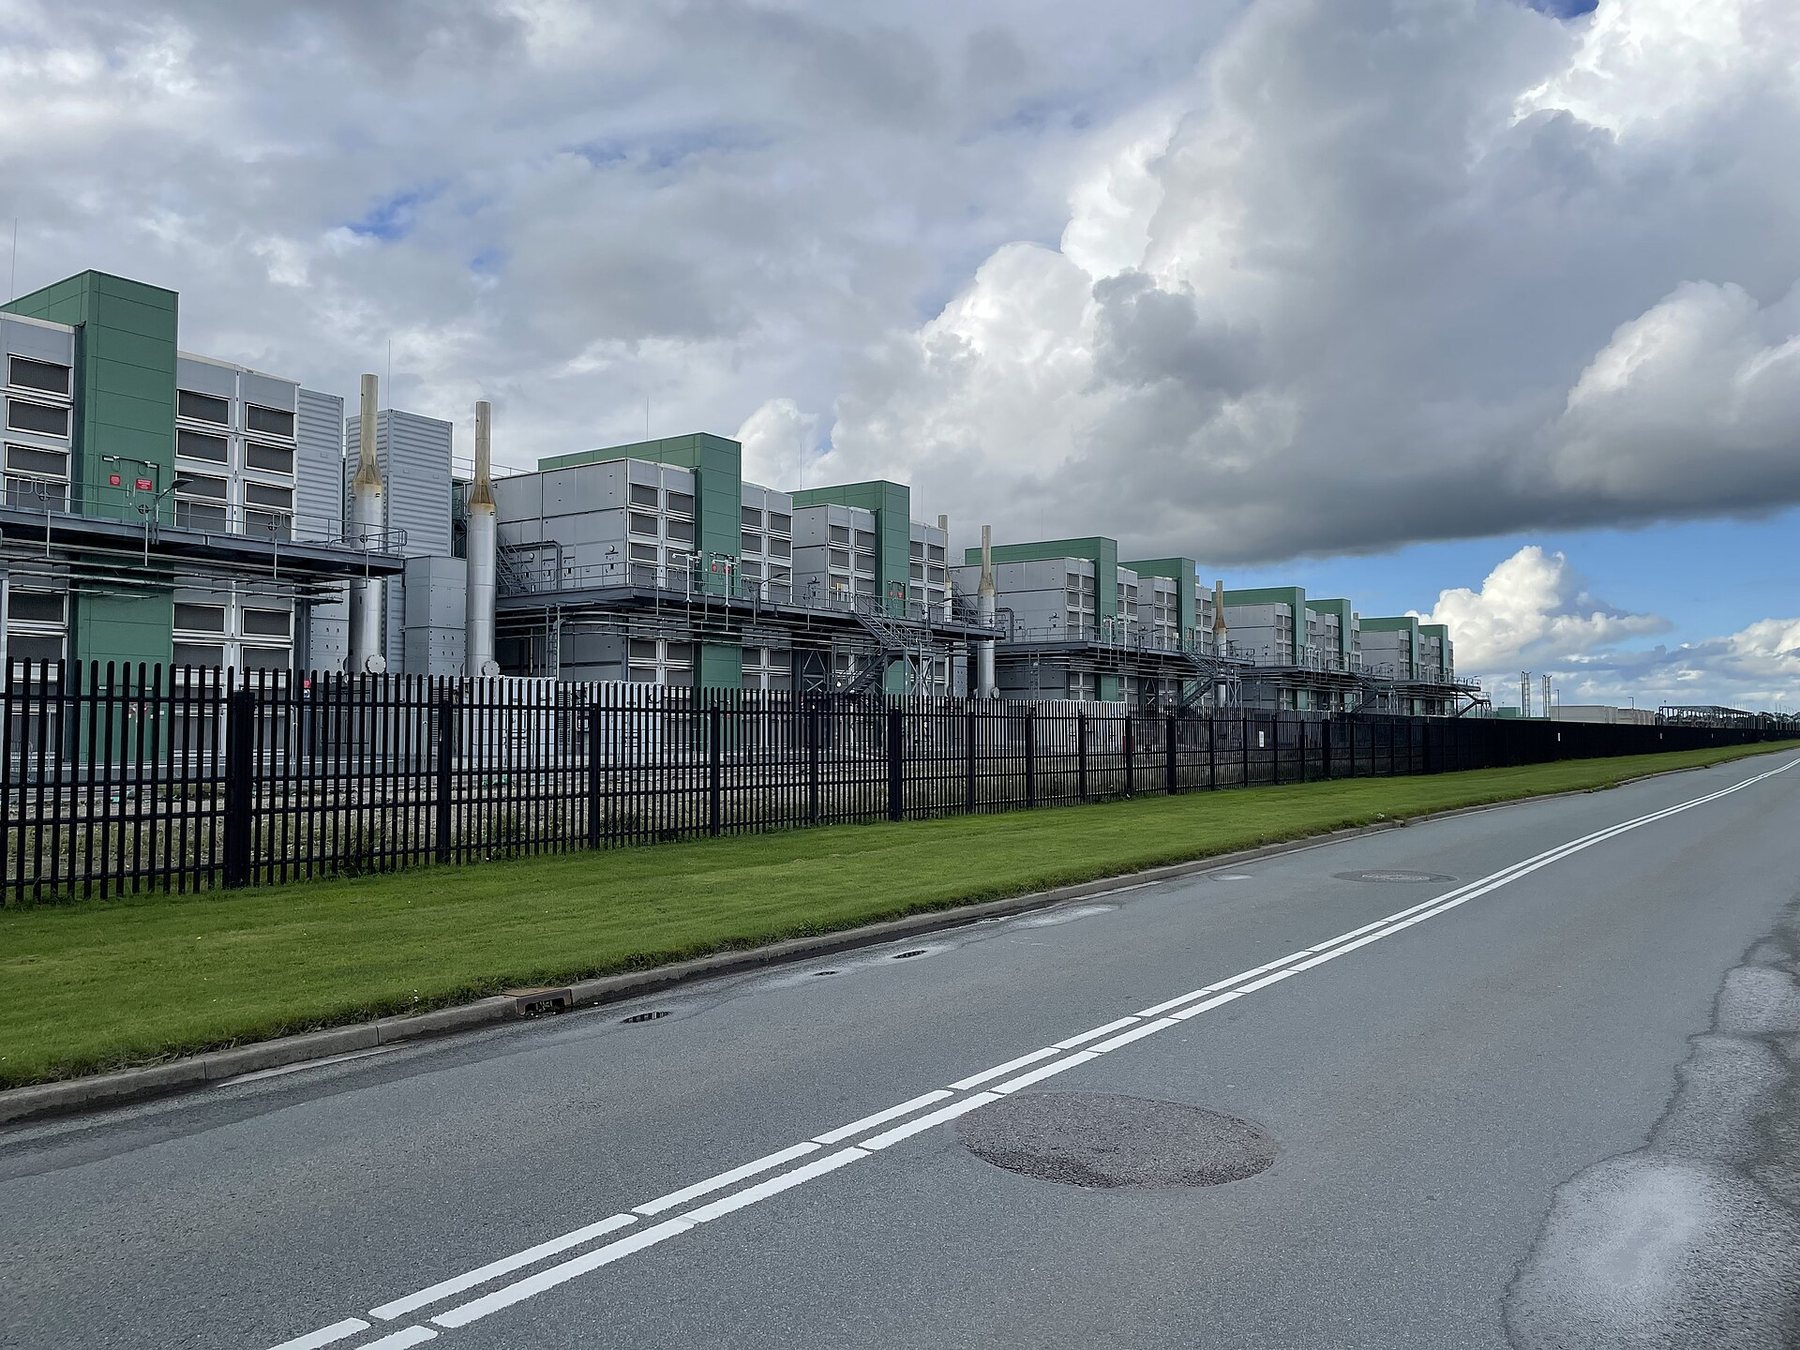
Power and build speed decide what gets delivered.
Manufacturing and logistics
Factories, warehouses and freight.
Factories and warehouses are short of people.
62
Factories and warehouses.
64
Warehouse automation is proven; unloading is young.
63
Factories and warehouses are short of people.
Manufacturing and logistics: thesis and evidence.
$3.0T
U.S. manufacturing value added
12.7M
U.S. manufacturing workers, Sep 2026
584K
Open manufacturing jobs, Sep 2026
$2.4T
U.S. business logistics costs, 2025
- Labor is the cost line machines replace first.
- Storage, picking and palletizing systems are proven.
- Robots as a service lowers the buyer’s capital outlay.
Thesis
- Amazon runs more than 1M robots across 300+ sites.
- Symbotic carries a $22.5B backlog but earns most revenue from one-time systems.
- Projects take about two years from announcement to completion.
Evidence
Proven systems with recurring service lines carry the evidence; utilization is the test. Go deeper: Primer 08 Manufacturing and Logistics.
Warehouse automation is proven; unloading is young.
Who is building, how proven, risks and signals.
- 1Who is building
Storage and picking: Symbotic, AutoStore Mobile robots: Geekplus, Amazon (in-house) Arms and cobots: ABB Robotics, Universal Robots
- 2How proven
Storage and palletizing: commercial Picking robots: commercial Forklift autonomy and unloading: early
- 3Main risks
Capex cycles Long project cycles Customer concentration Integration cost
- 4What to watch
Backlog conversion Software and service growth RaaS adoption Labor cost trend
Look for backlog that converts and revenue that recurs.
Factories and warehouses.
Representative machines and sites.
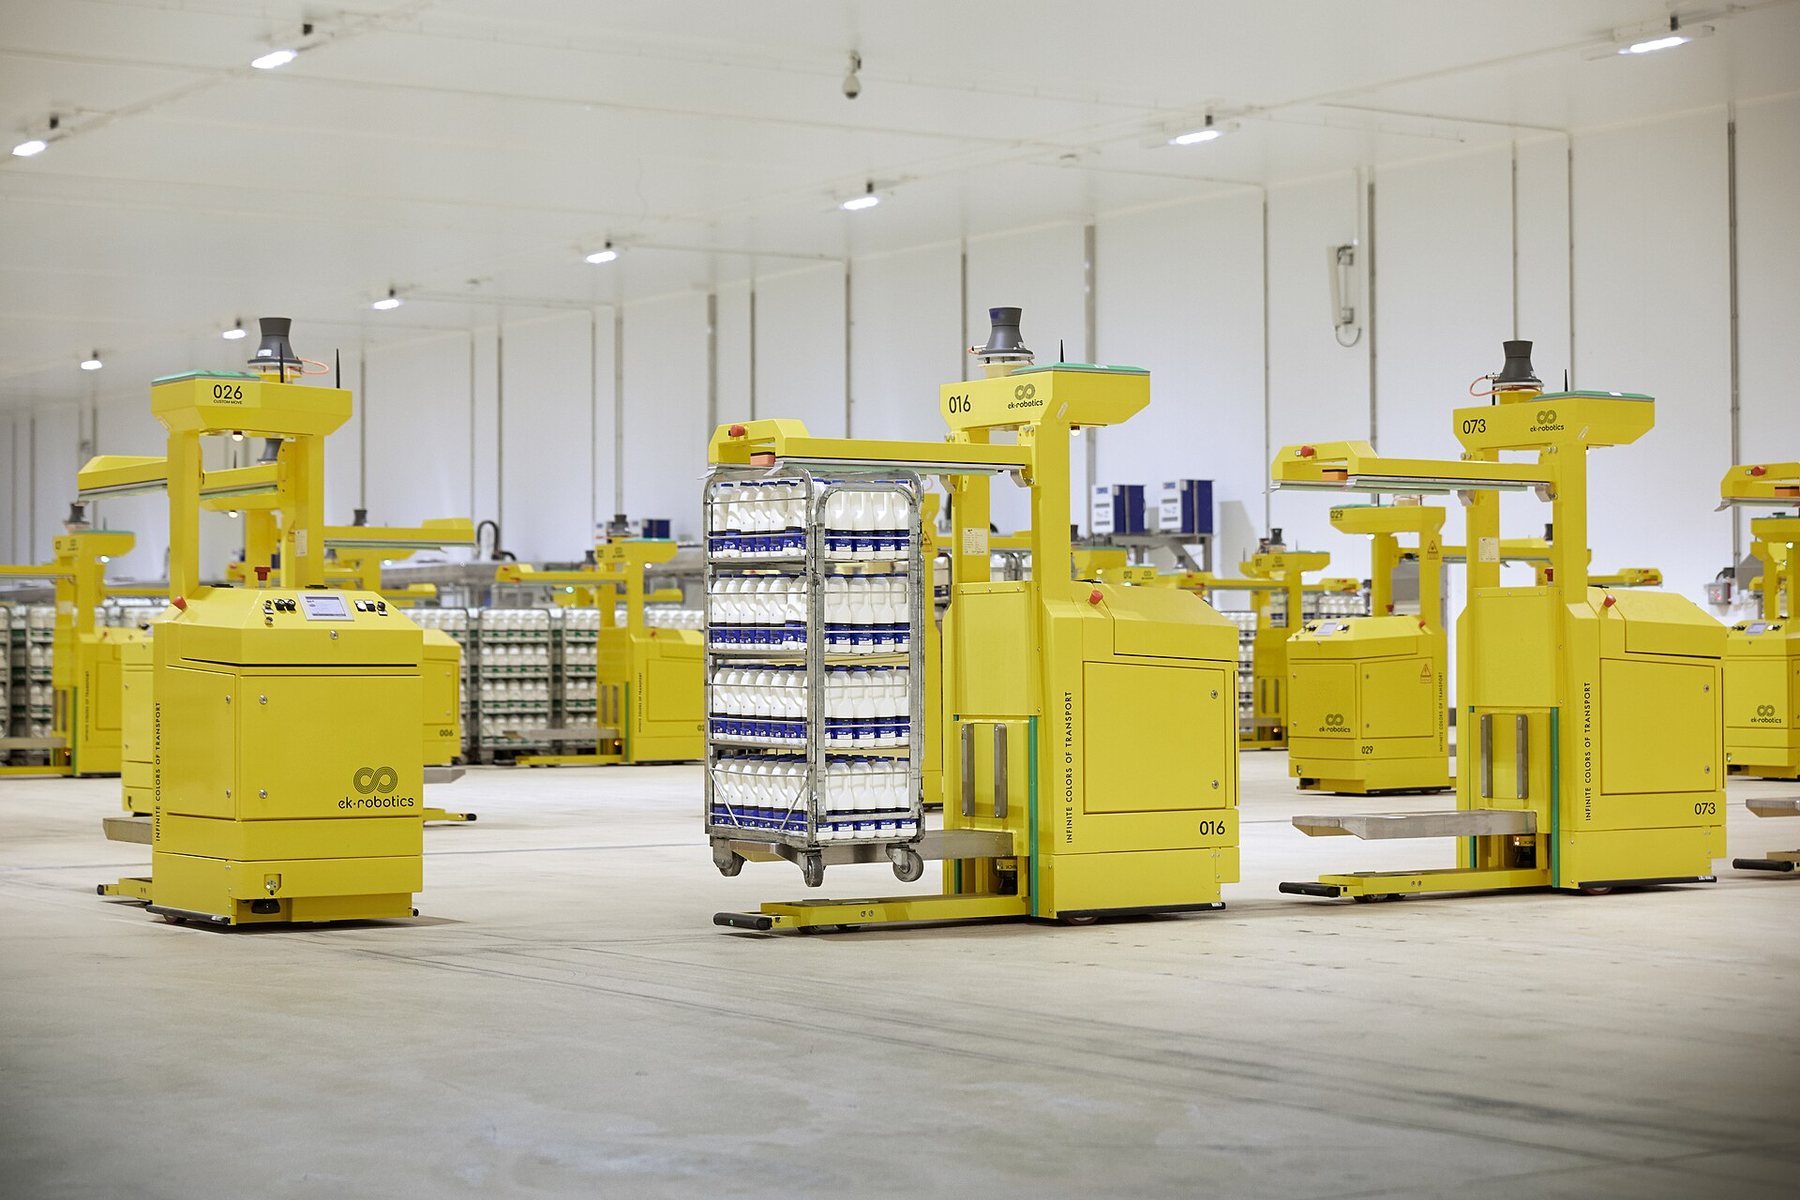
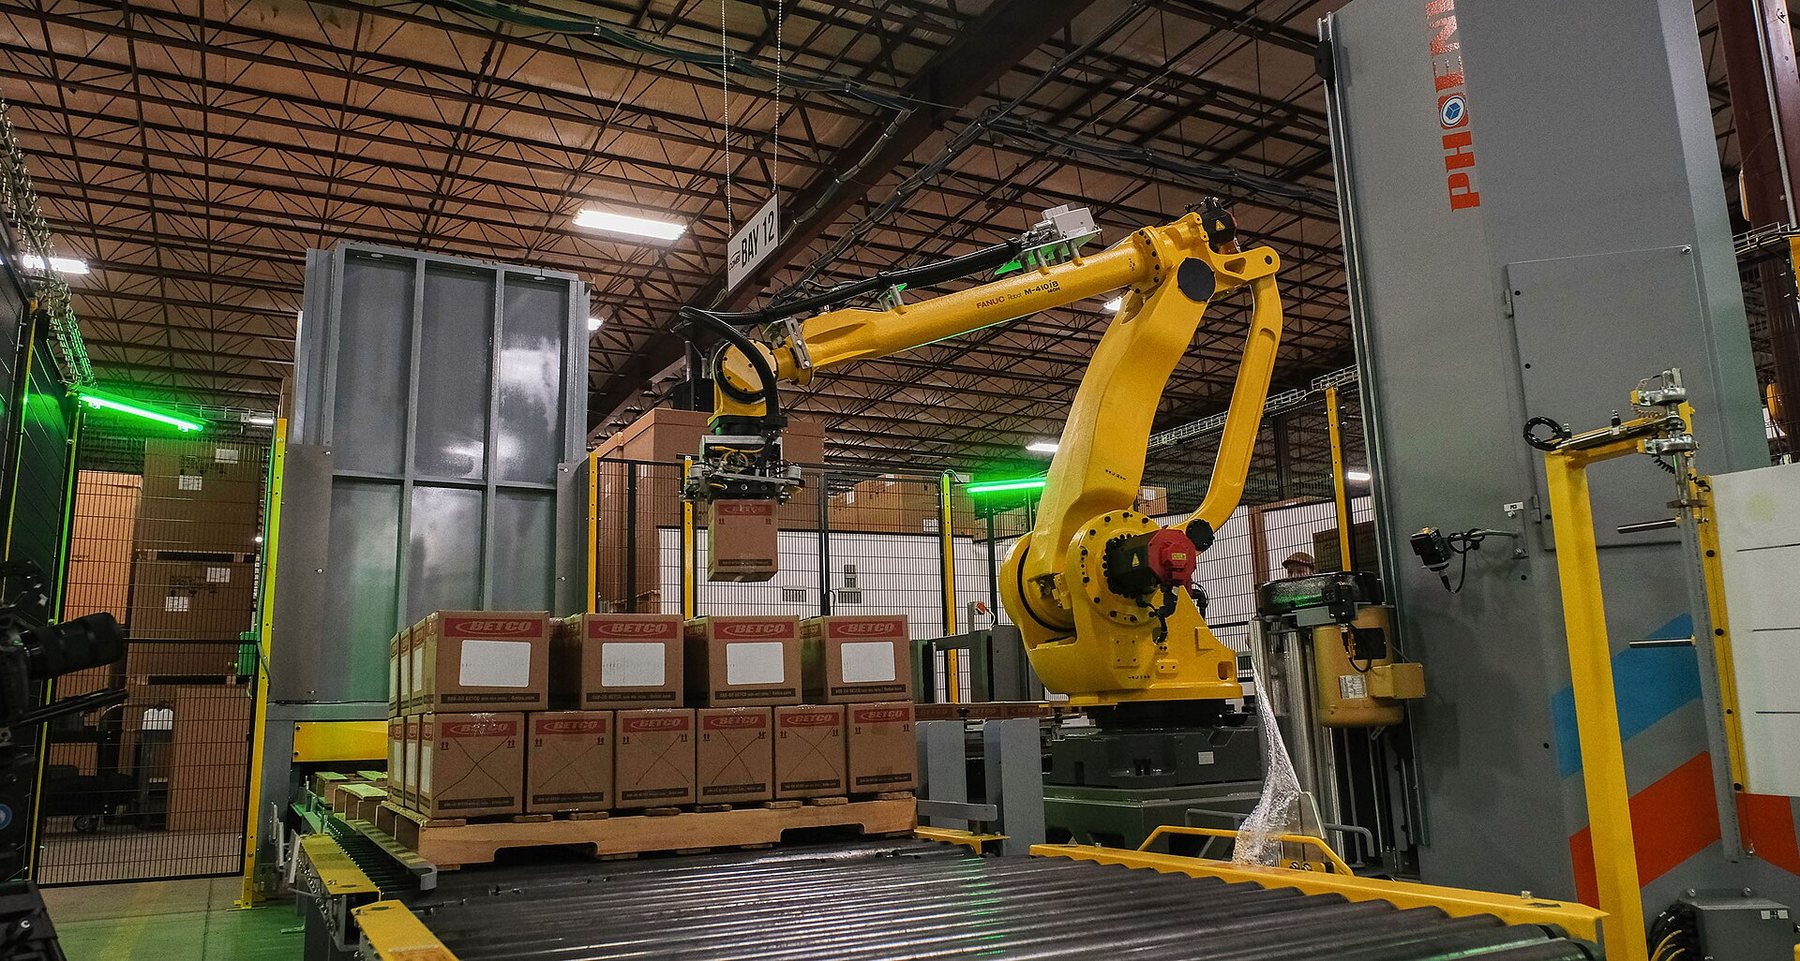
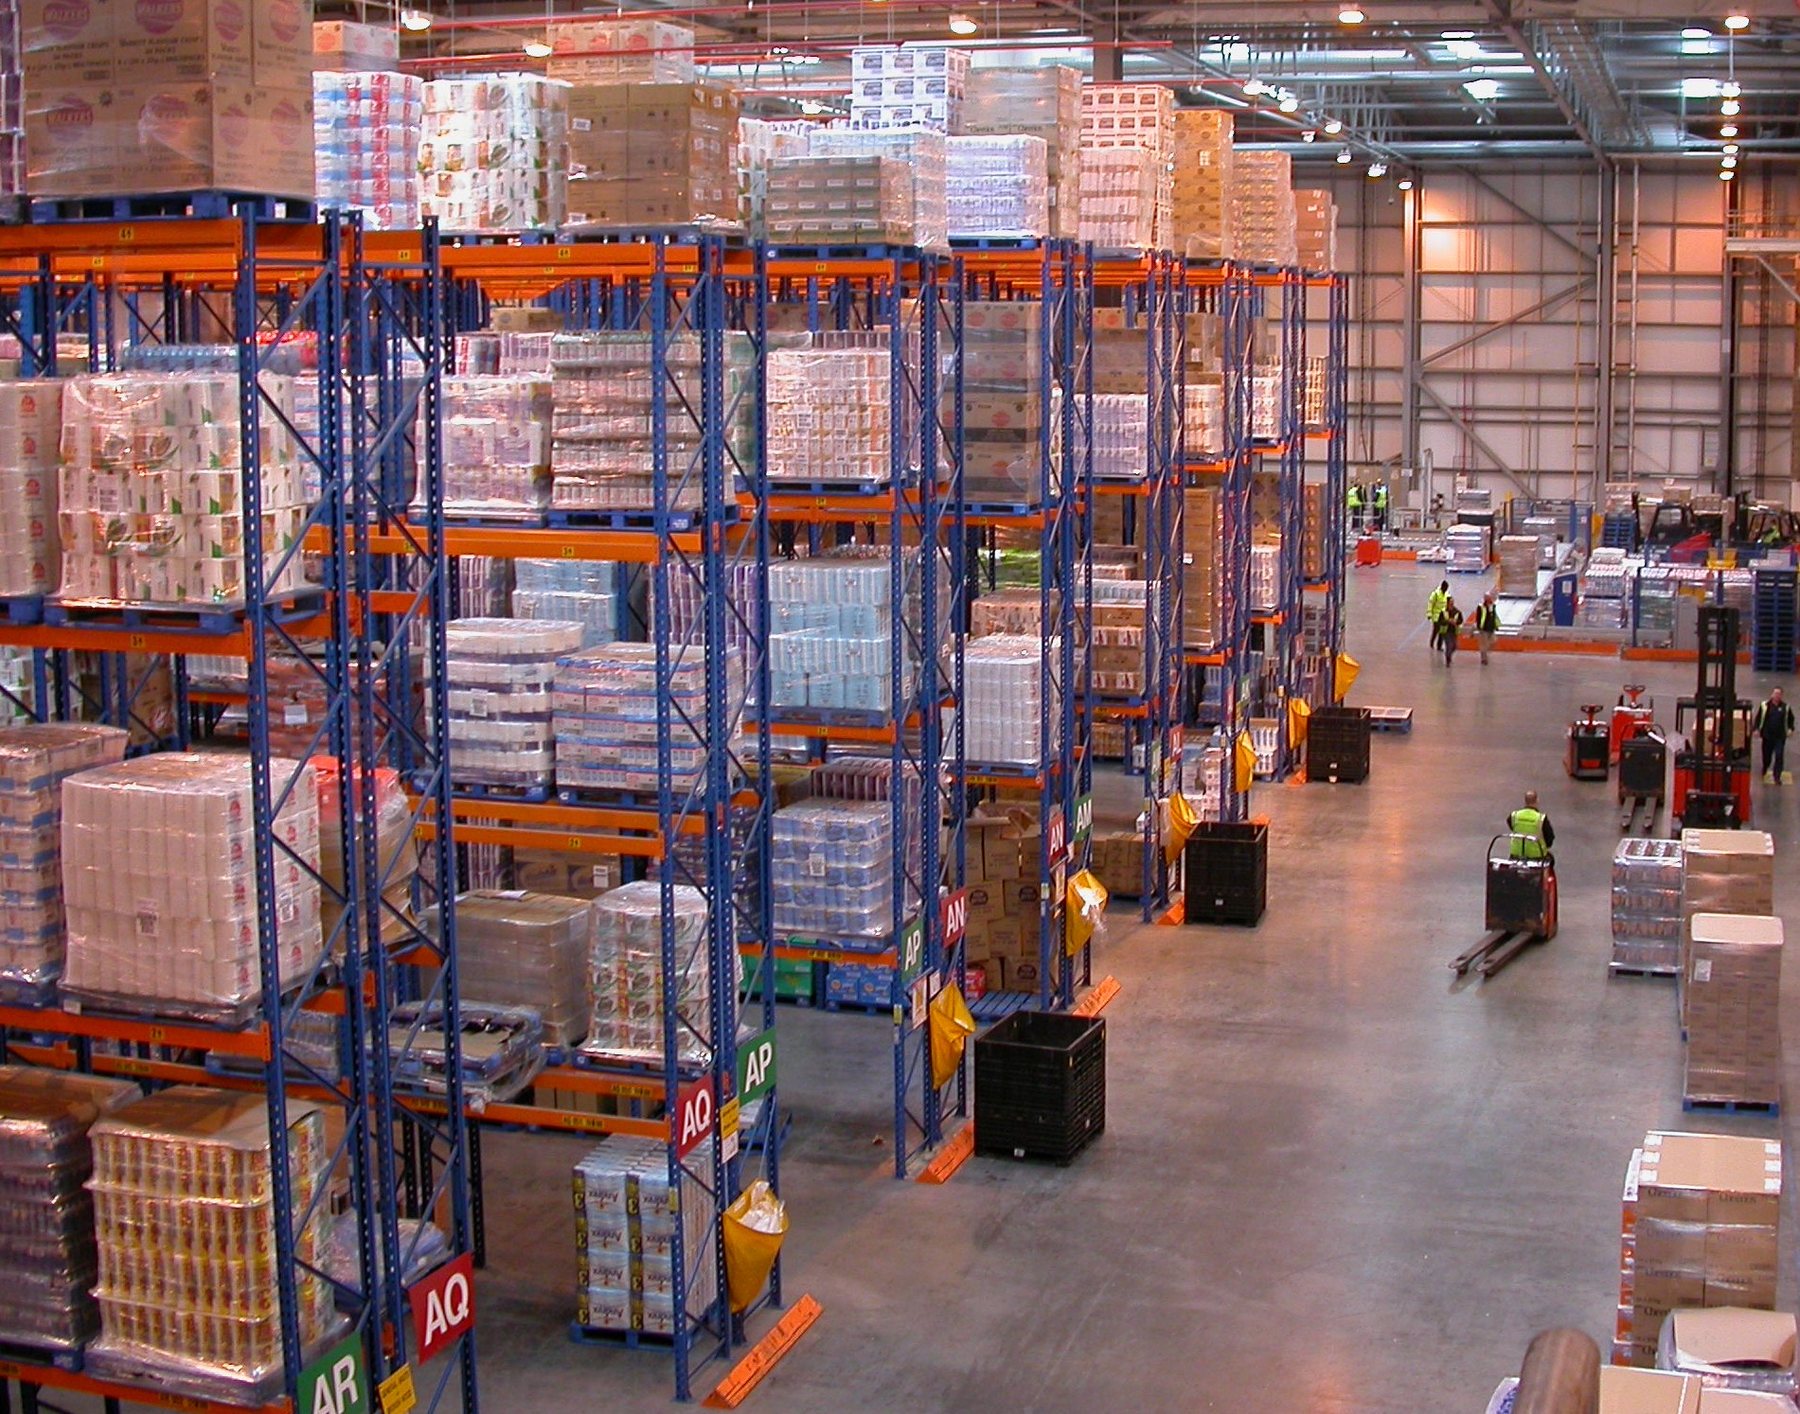
Proven systems with recurring revenue come first.
Construction and infrastructure
Buildings, networks and utilities.
Construction is big, risky and short of workers.
66
Machines on the job site.
68
Survey is commercial; machines on site are early.
67
Construction is big, risky and short of workers.
Construction and infrastructure: thesis and evidence.
$2.19T
U.S. construction spending, Sep 2026, annual rate
349K
Net new construction workers needed in 2026 (ABC)
~10%
Productivity gain 2000 to 2022; whole economy about 50%
79%
Surveyed contractors using jobsite robots
- Productivity has barely moved in 22 years.
- Work repeats and follows a model: layout, drilling, survey, inspection.
- Design-build is heading for half of U.S. spending.
Thesis
- One in five U.S. workplace deaths is in construction: 1,034 in 2024.
- Spending fell 2.7% in the latest year.
- Data centers and power lead growth, where trades are scarcest.
Evidence
The labor gap and flat productivity make buyers open to machines. Go deeper: Primer 09 Construction and Infrastructure.
Survey is commercial; machines on site are early.
Who is building, how proven, risks and signals.
- 1Who is building
Layout and drilling robots Drones for survey and progress capture Autonomous equipment makers
- 2How proven
Drone survey: commercial Layout and drilling: early commercial Autonomous earthmoving: early Humanoids on site: pilot
- 3Main risks
Fragmented buyers Thin contractor margins Slow project-by-project adoption Safety and liability
- 4What to watch
Design-build share Data center and power projects Contractor adoption surveys Insurance and safety rules
The stronger companies sell through contractors and measure hours saved per project.
Machines on the job site.
Representative machines and sites.
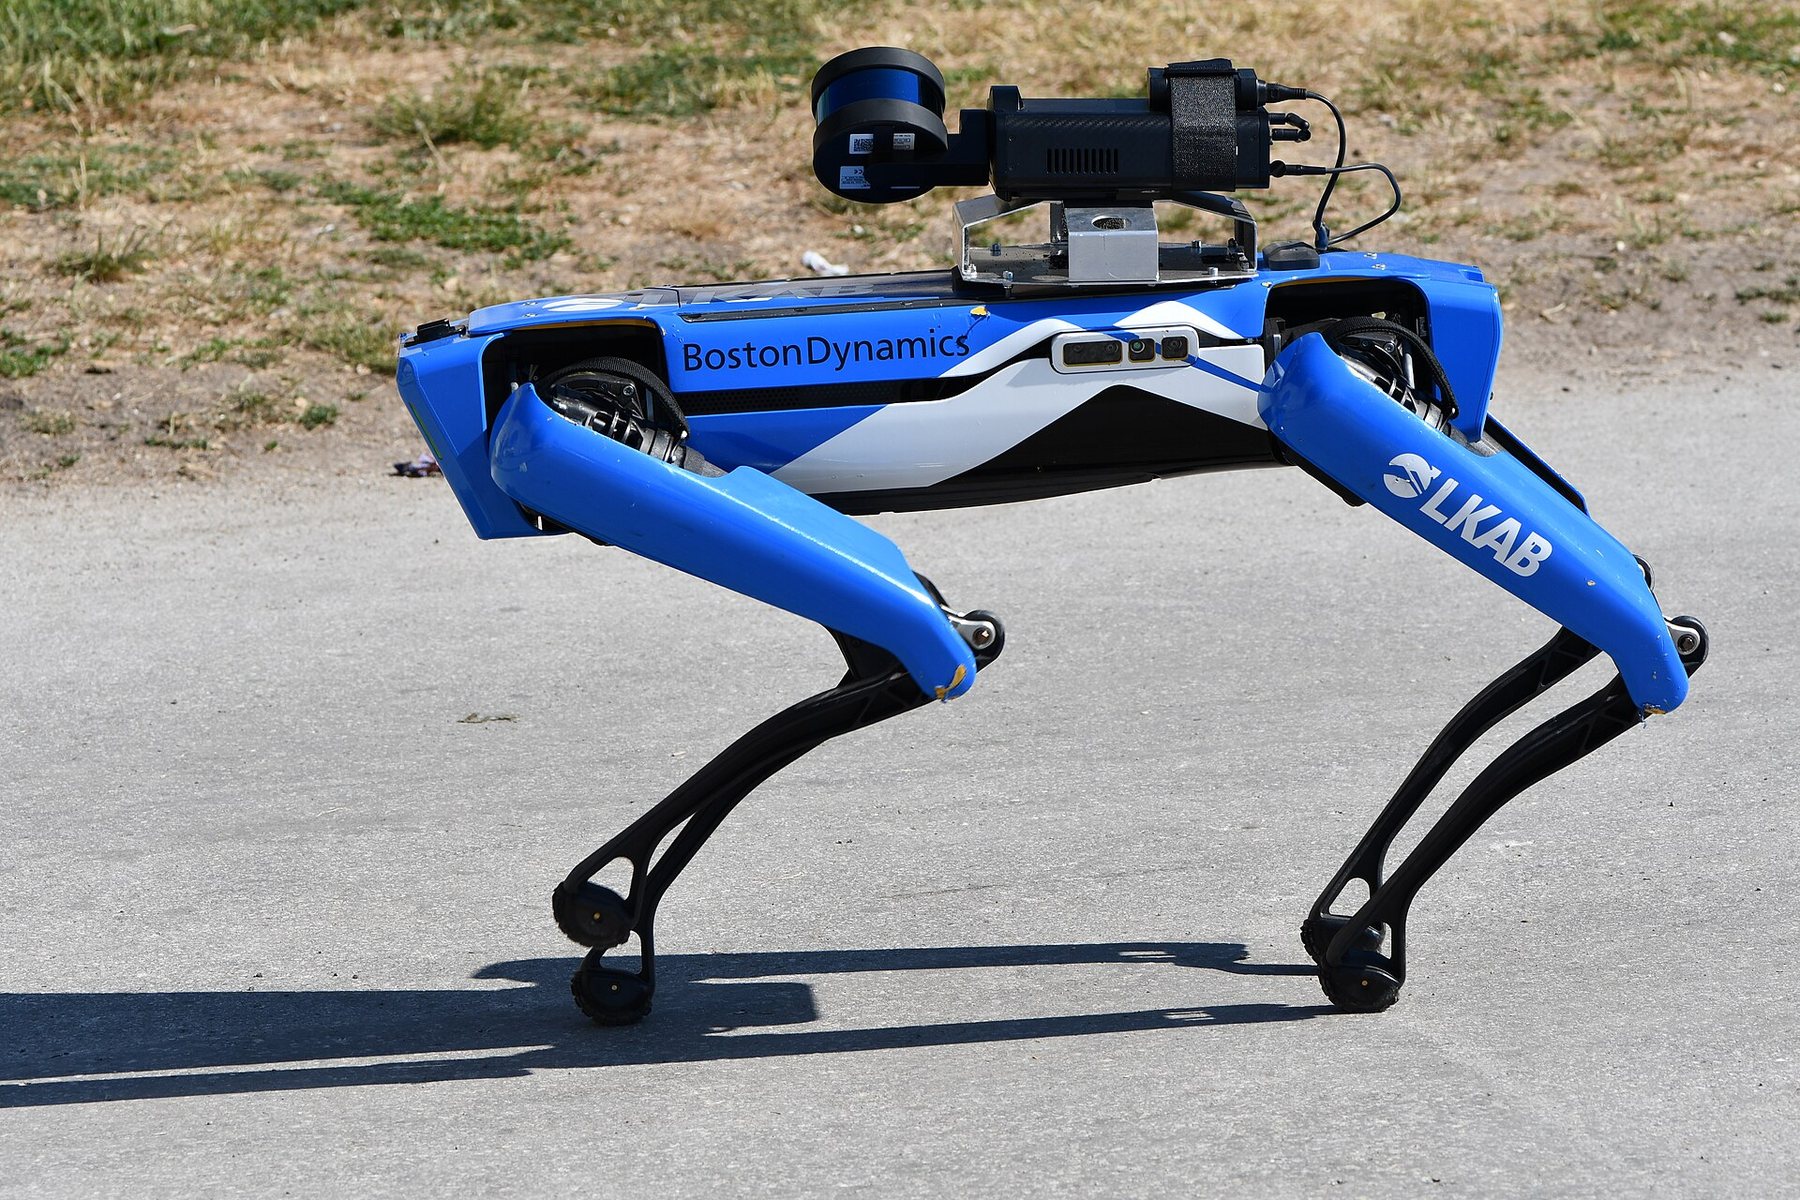
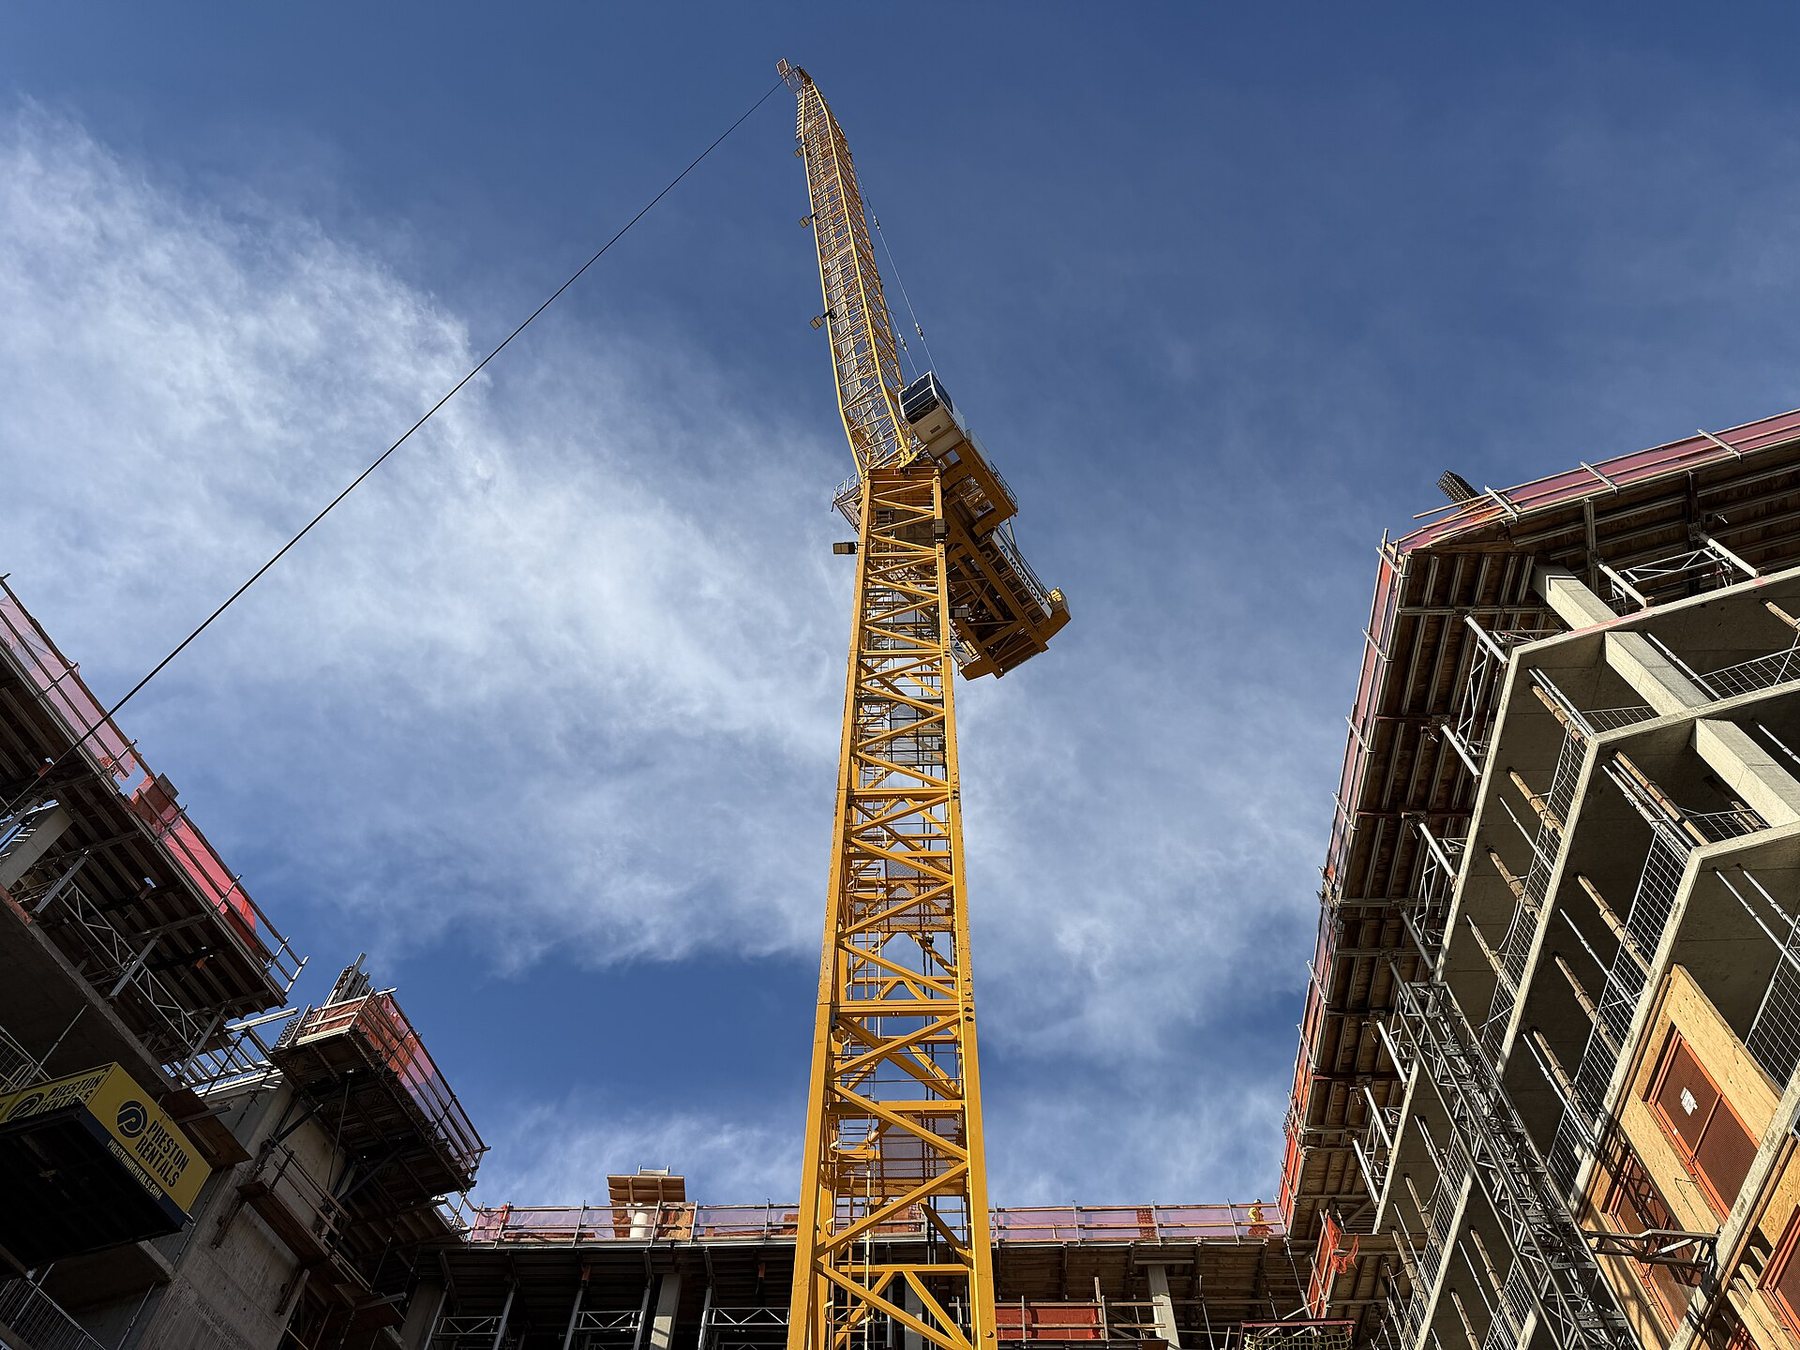
Survey is commercial; machines on site are early.
Public safety and defense
Fragmented public safety and concentrated defense money.
Defense is concentrated; public safety is fragmented.
70
Public safety machines.
72
Some jobs are proven, others are pilots.
71
Defense is concentrated; public safety is fragmented.
Public safety and defense: thesis and evidence.
$839B
FY2026 U.S. defense appropriations
~17,500
State and local law enforcement agencies
1,000+
Agencies cleared for drone first-responder flights
$61B
Anduril valuation, May 2026
- Large budgets and recruiting gaps push buyers to autonomy.
- Drone first responder and hazardous-entry robots are commercial.
- Defense autonomy draws the largest private rounds in physical AI.
Thesis
- Defense tech raised $8.5B in 2025, more than double 2024.
- SBIR and STTR reopened in April 2026.
- 50+ U.S. communities ended or switched off police camera contracts in 2026.
Evidence
Trust and procurement set the pace more than technology does. Go deeper: Primer 10 Public Safety and Defense.
Some jobs are proven, others are pilots.
Who is building, how proven, risks and signals.
- 1Who is building
Anduril, Saronic, Skydio, AeroVironment Drone first-responder platforms Hazardous-entry and patrol robot makers
- 2How proven
Drone as first responder: commercial Hazardous entry and EOD support: commercial Patrol robots: early commercial Depot inspection and maintenance: pilot
- 3Main risks
Trust, privacy and civil liberties Long procurement cycles Foreign-made drone rules Cyber and export rules
- 4What to watch
Grants and contract vehicles Community-control laws SBIR and STTR awards Defense autonomy rounds
Investors look for a government customer, a compliance record and a trust program.
Public safety machines.
Representative machines and sites.
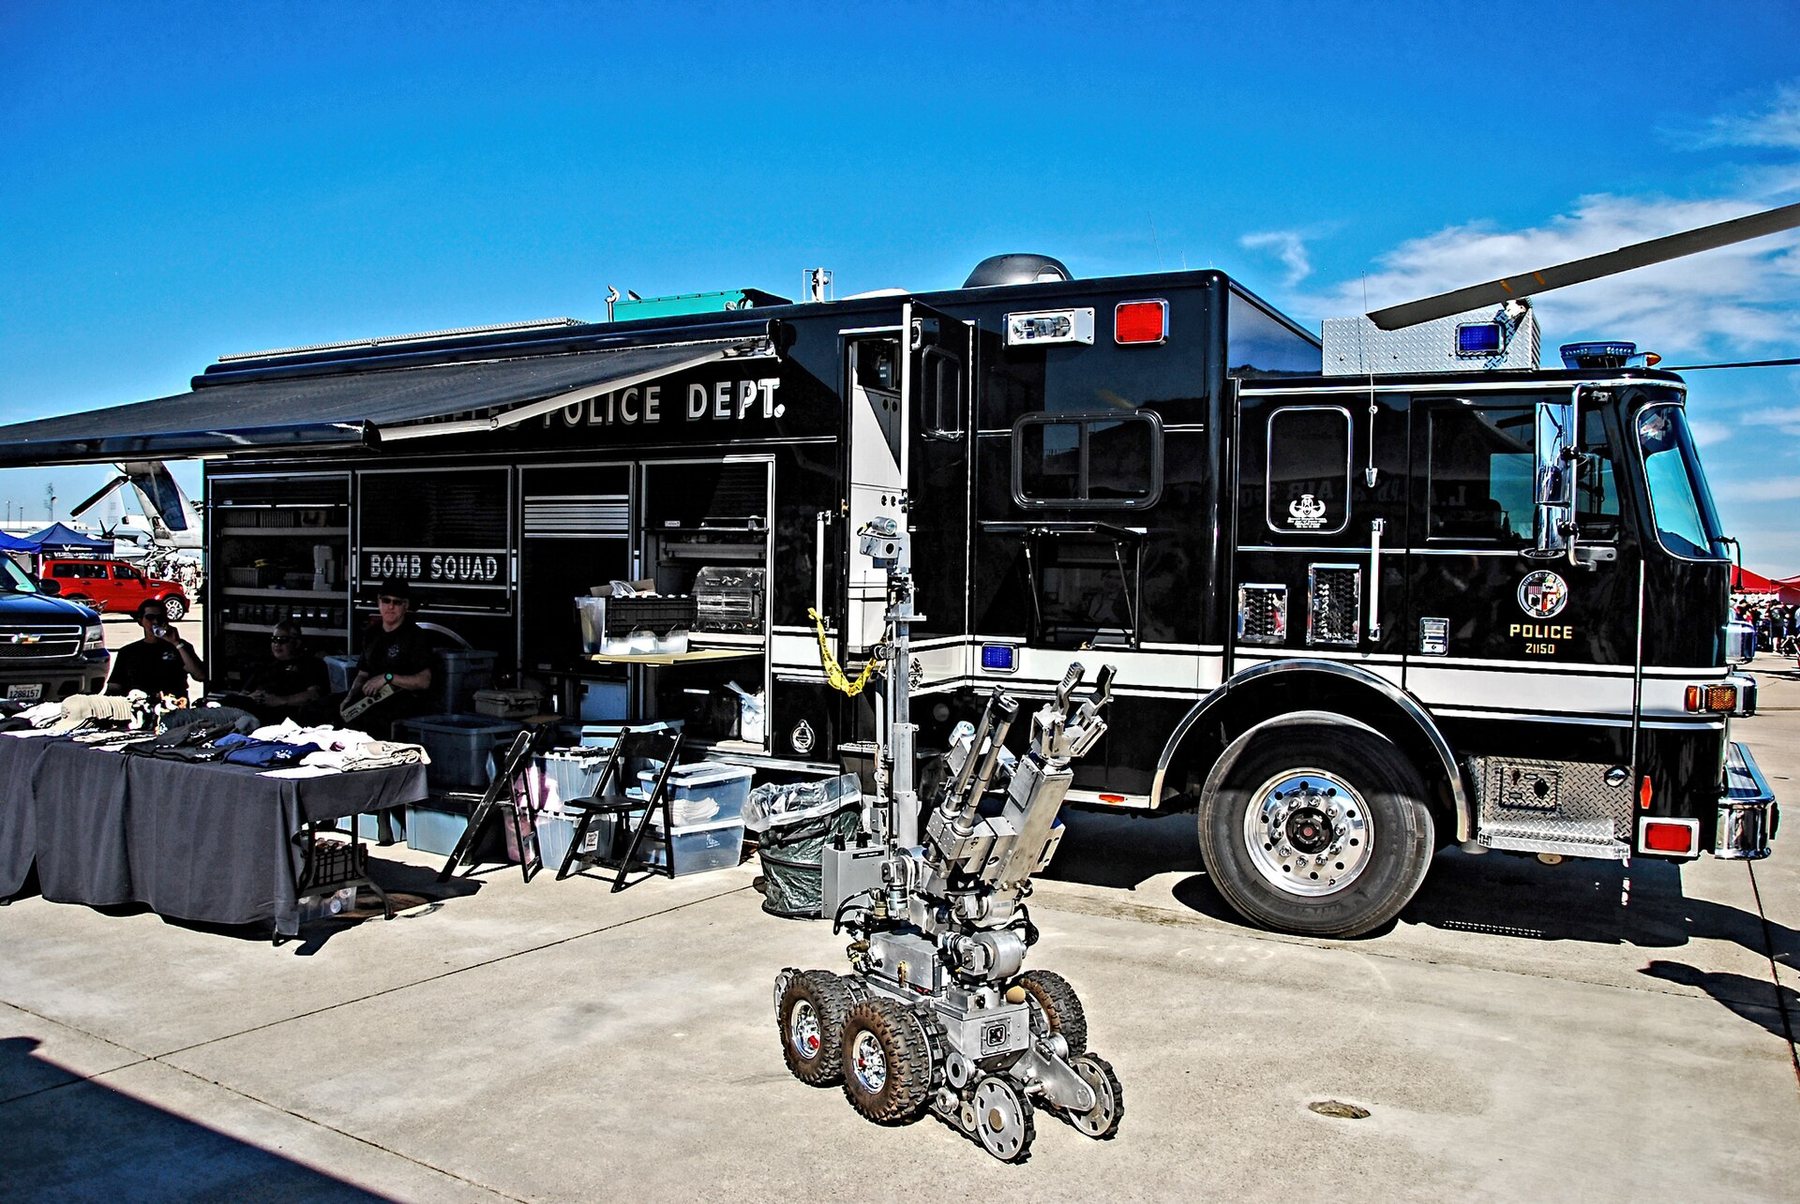

Some jobs are proven, others are pilots.
Commercial services
Healthcare, hospitality, real estate, food, agriculture, retail and waste.
Service work turns over fast, so robots pay back.
74
Service robots at work.
76
Four service robot types are commercial.
75
Service work turns over fast, so robots pay back.
Commercial services: thesis and evidence.
137M
U.S. jobs in service-providing industries, Sep 2026
~250K
Professional service robots shipped in 2025
47%
Share of units in transport and logistics
29.2%
Turnover of on-site apartment staff, 2025
- Service work is the largest labor pool and turns over fast.
- Delivery, floor cleaning, disinfection and guidance robots are commercial.
- Robots as a service is the common U.S. model.
Thesis
- A robot pays back when freed hours are worth more than its monthly cost.
- Illustration: $1,000 a month ÷ 40 hours = break-even at $25 an hour loaded.
- Guests and patients accept machines that help quietly.
Evidence
Operators already buy at scale; makers sell outcomes by the hour or the task. Go deeper: Primer 11 Commercial Services.
Four service robot types are commercial.
Who is building, how proven, risks and signals.
- 1Who is building
Cleaning, delivery and disinfection robot makers Hospitality guide and telepresence makers Kitchen and agriculture robot makers
- 2How proven
Delivery, cleaning, disinfection, guidance: commercial Kitchen, harvesting: early commercial Companion robots: pilot Humanoids: pilot
- 3Main risks
Slow operator buying Brand and privacy Utilization on thin margins Humanoid hype
- 4What to watch
Pilot-to-rollout rates RaaS contract terms Hospital and hotel chains Standards such as ISO 13482
Look for operators who measure hours freed and turnover avoided.
Service robots at work.
Representative machines and sites.
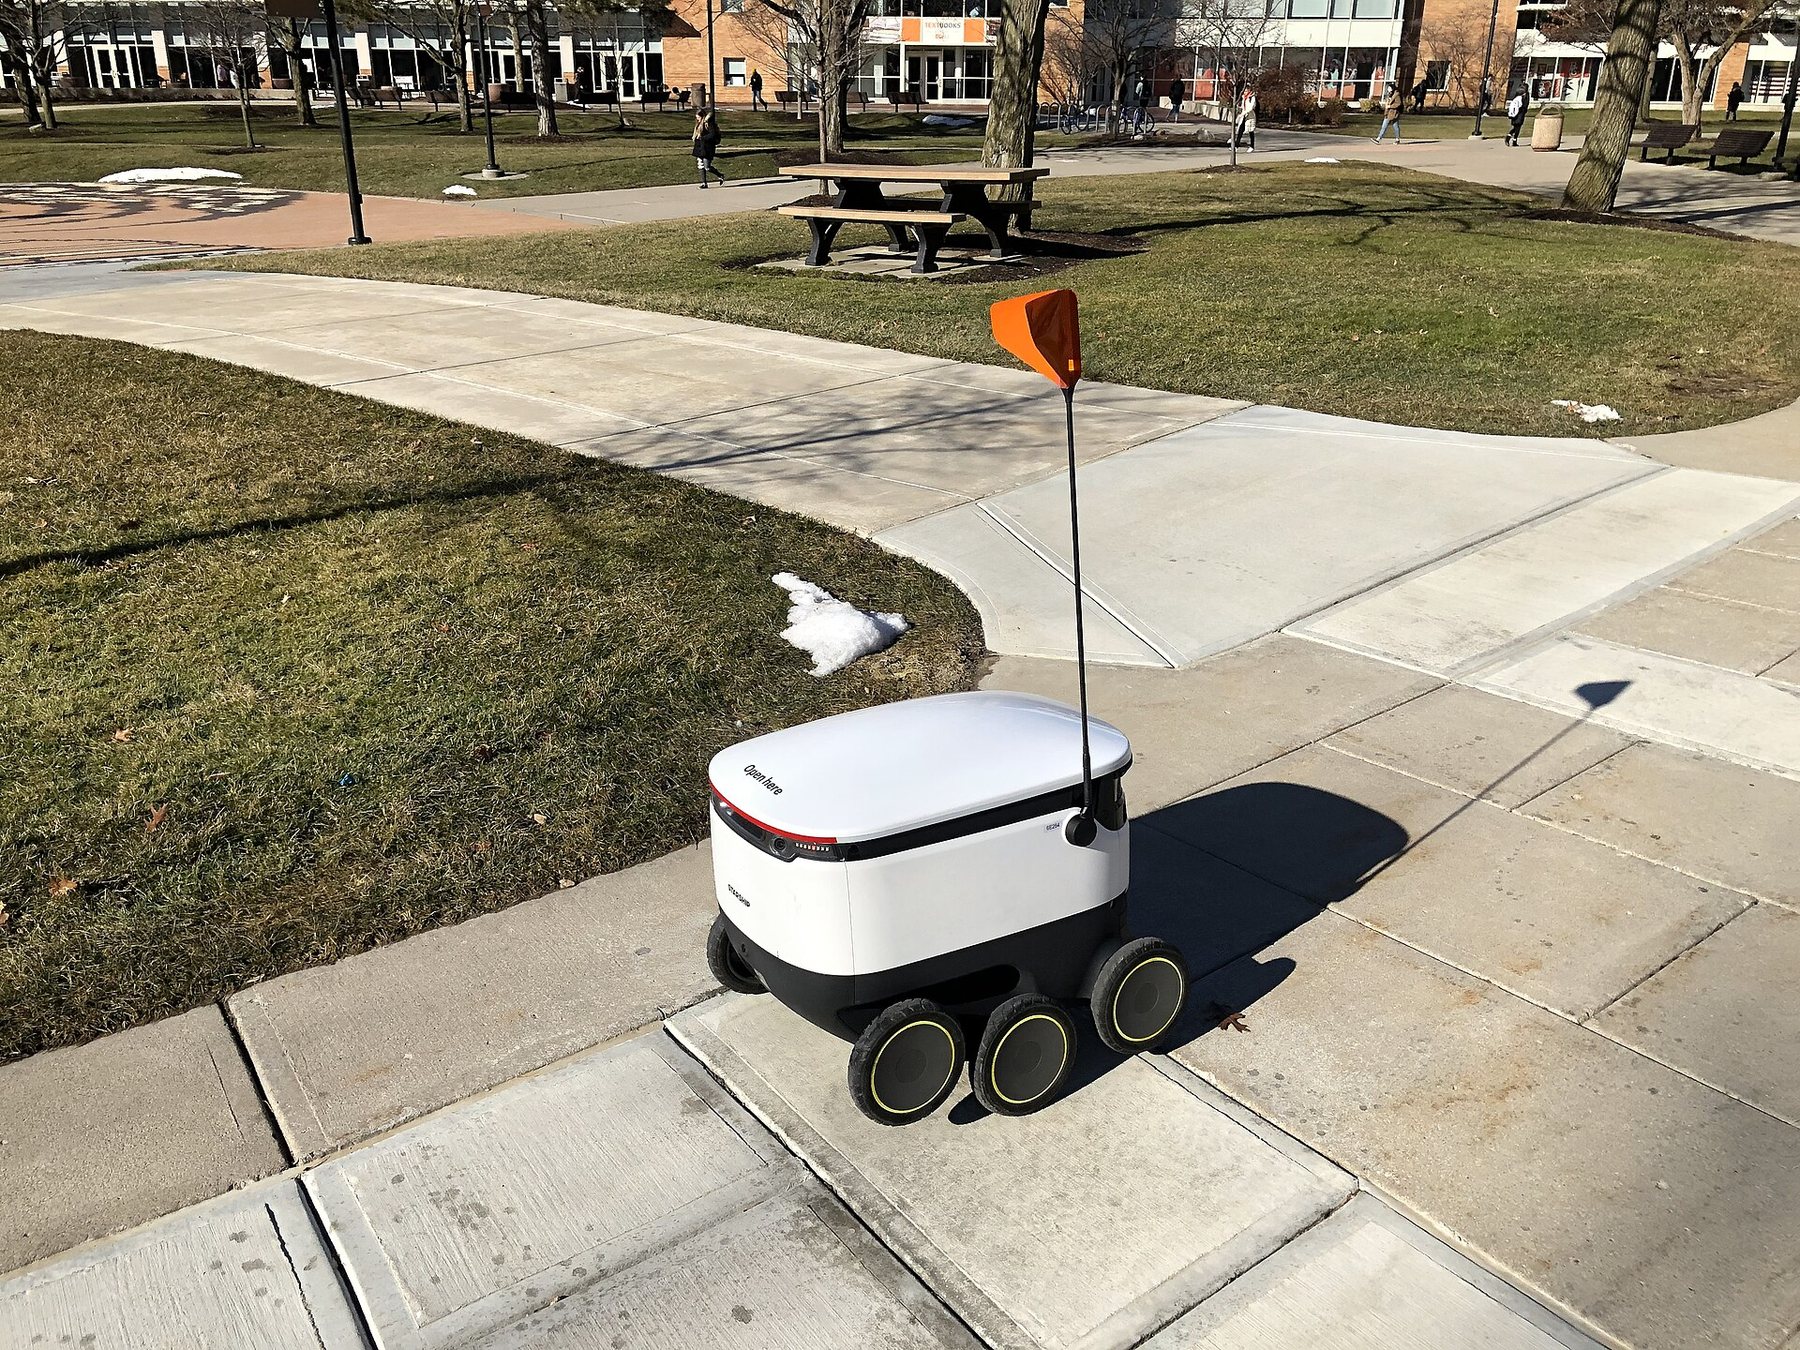
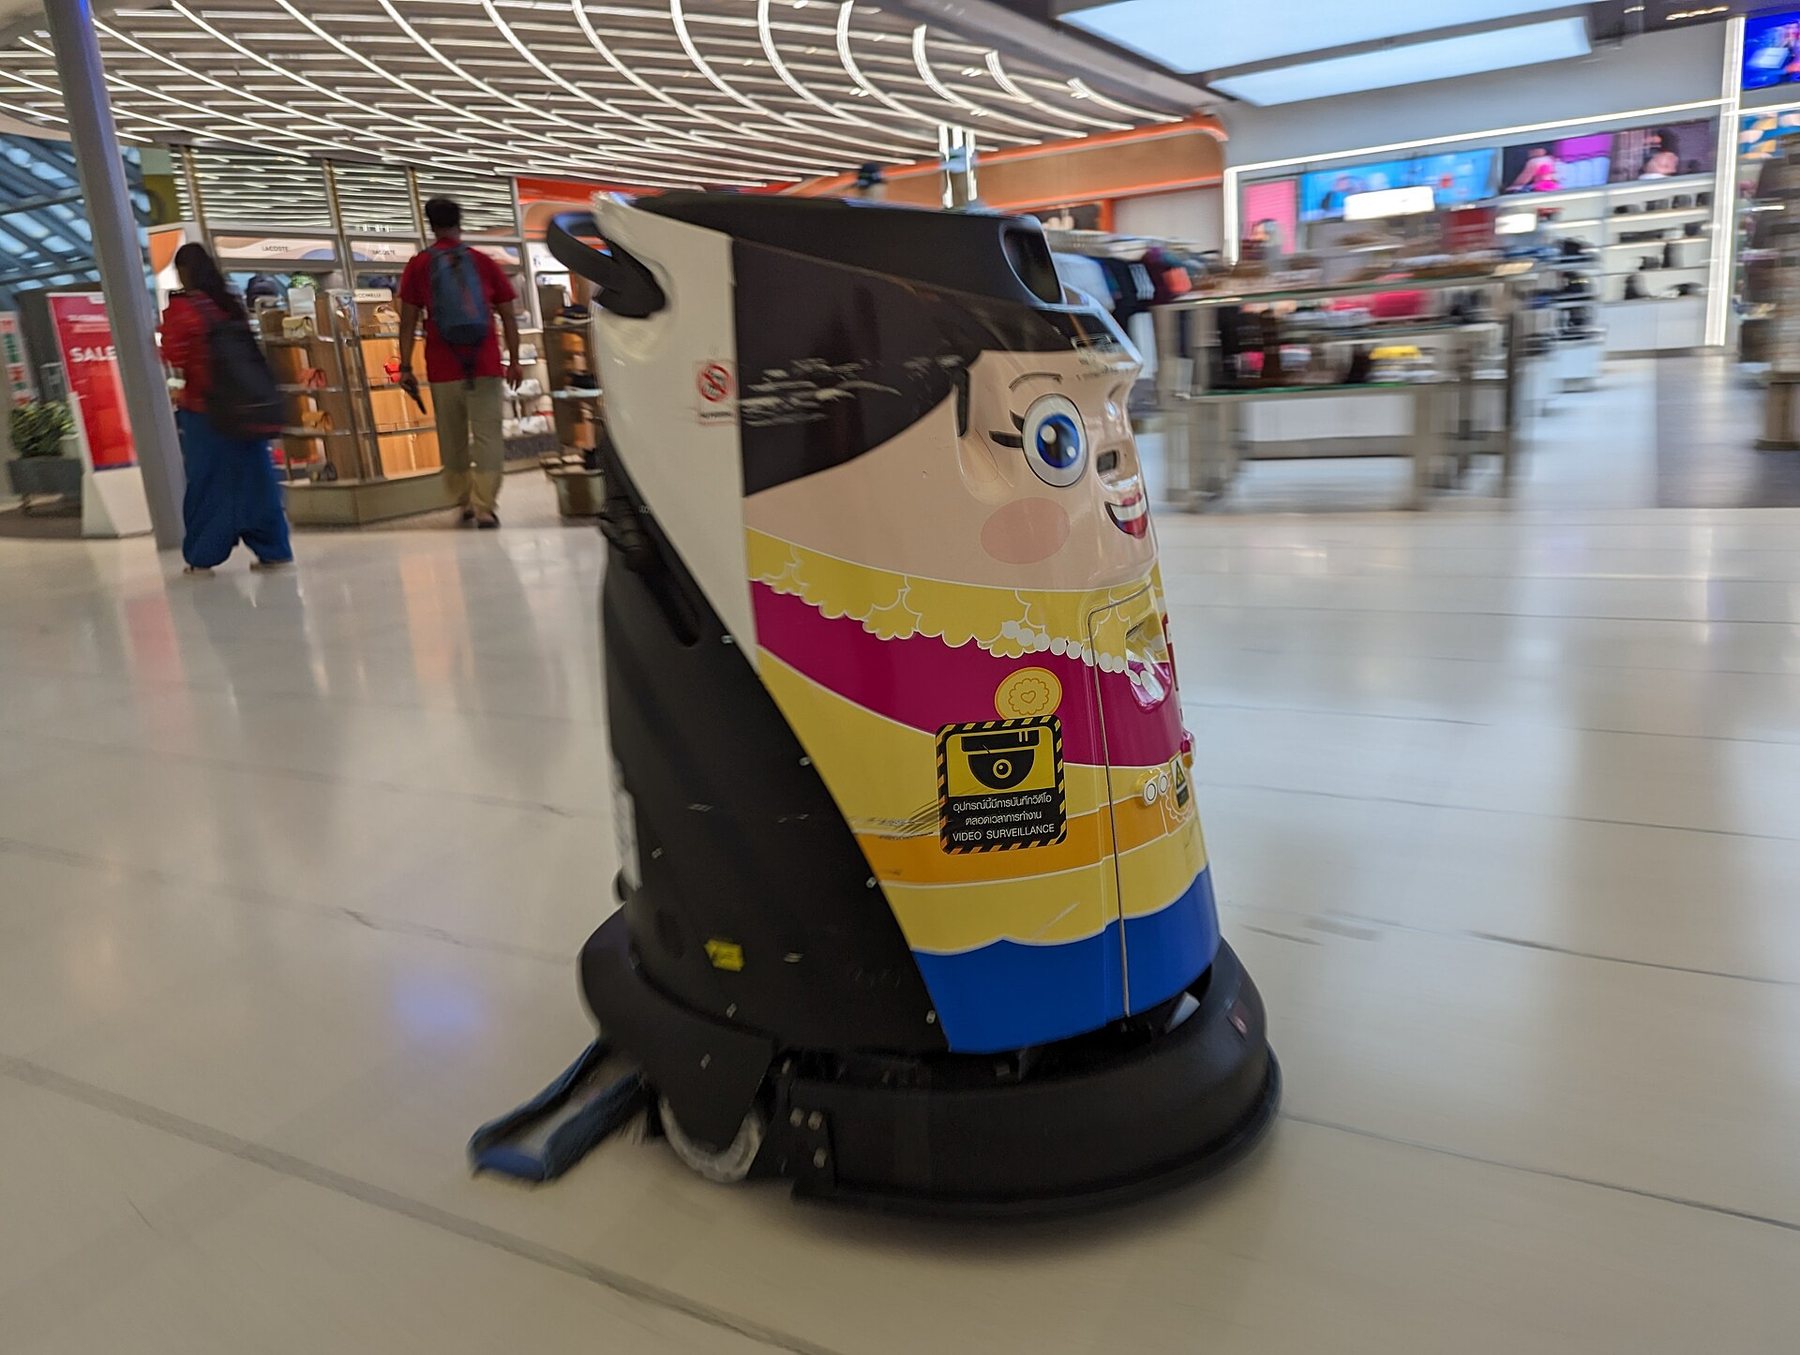
Operators that measure hours freed see the payback.
Channel
The contractors and integrators who take machines to projects.
Contractors carry machines to projects.
78
Where machines meet contractors.
80
Four places a machine scope can sit.
79
Contractors carry machines to projects.
Channel: thesis and evidence.
$2.19T
U.S. construction spending, Sep 2026, annual rate
11.8%
Growth of the largest contractors in 2025
79%
Surveyed contractors using jobsite robots
349K
Workers the industry must add in 2026
- Contractors and integrators are the route to market for machines on projects.
- Atomgigs sits between the machine maker and the project, so the client deals with one team.
- A machine scope is a specialty scope inside a contract form the contractor already uses.
Thesis
- Design-build is becoming the default.
- A few hundred firms shape most large projects; thousands of specialty firms build them.
- The fastest-growing firms build data centers and power.
Evidence
A strong channel multiplies a machine maker’s reach without multiplying its sales cost. Go deeper: Primer 06 Channel Partners.
Four places a machine scope can sit.
Who is building, how proven, risks and signals.
- 1Who is building
Large general contractors Specialty trade contractors Design-builders and engineers
- 2How proven
Contractor trials are widespread Pay for capacity and outcomes: no capital outlay for machines Partnership models are defined
- 3Main risks
Contractor margin Contract terms and liability Project-by-project sales Partner concentration
- 4What to watch
Backlog growth Partner adoption Delivery method mix Owner mandates
Channel strength is a diligence question: who sells the machine, and who runs it?
Where machines meet contractors.
Representative machines and sites.
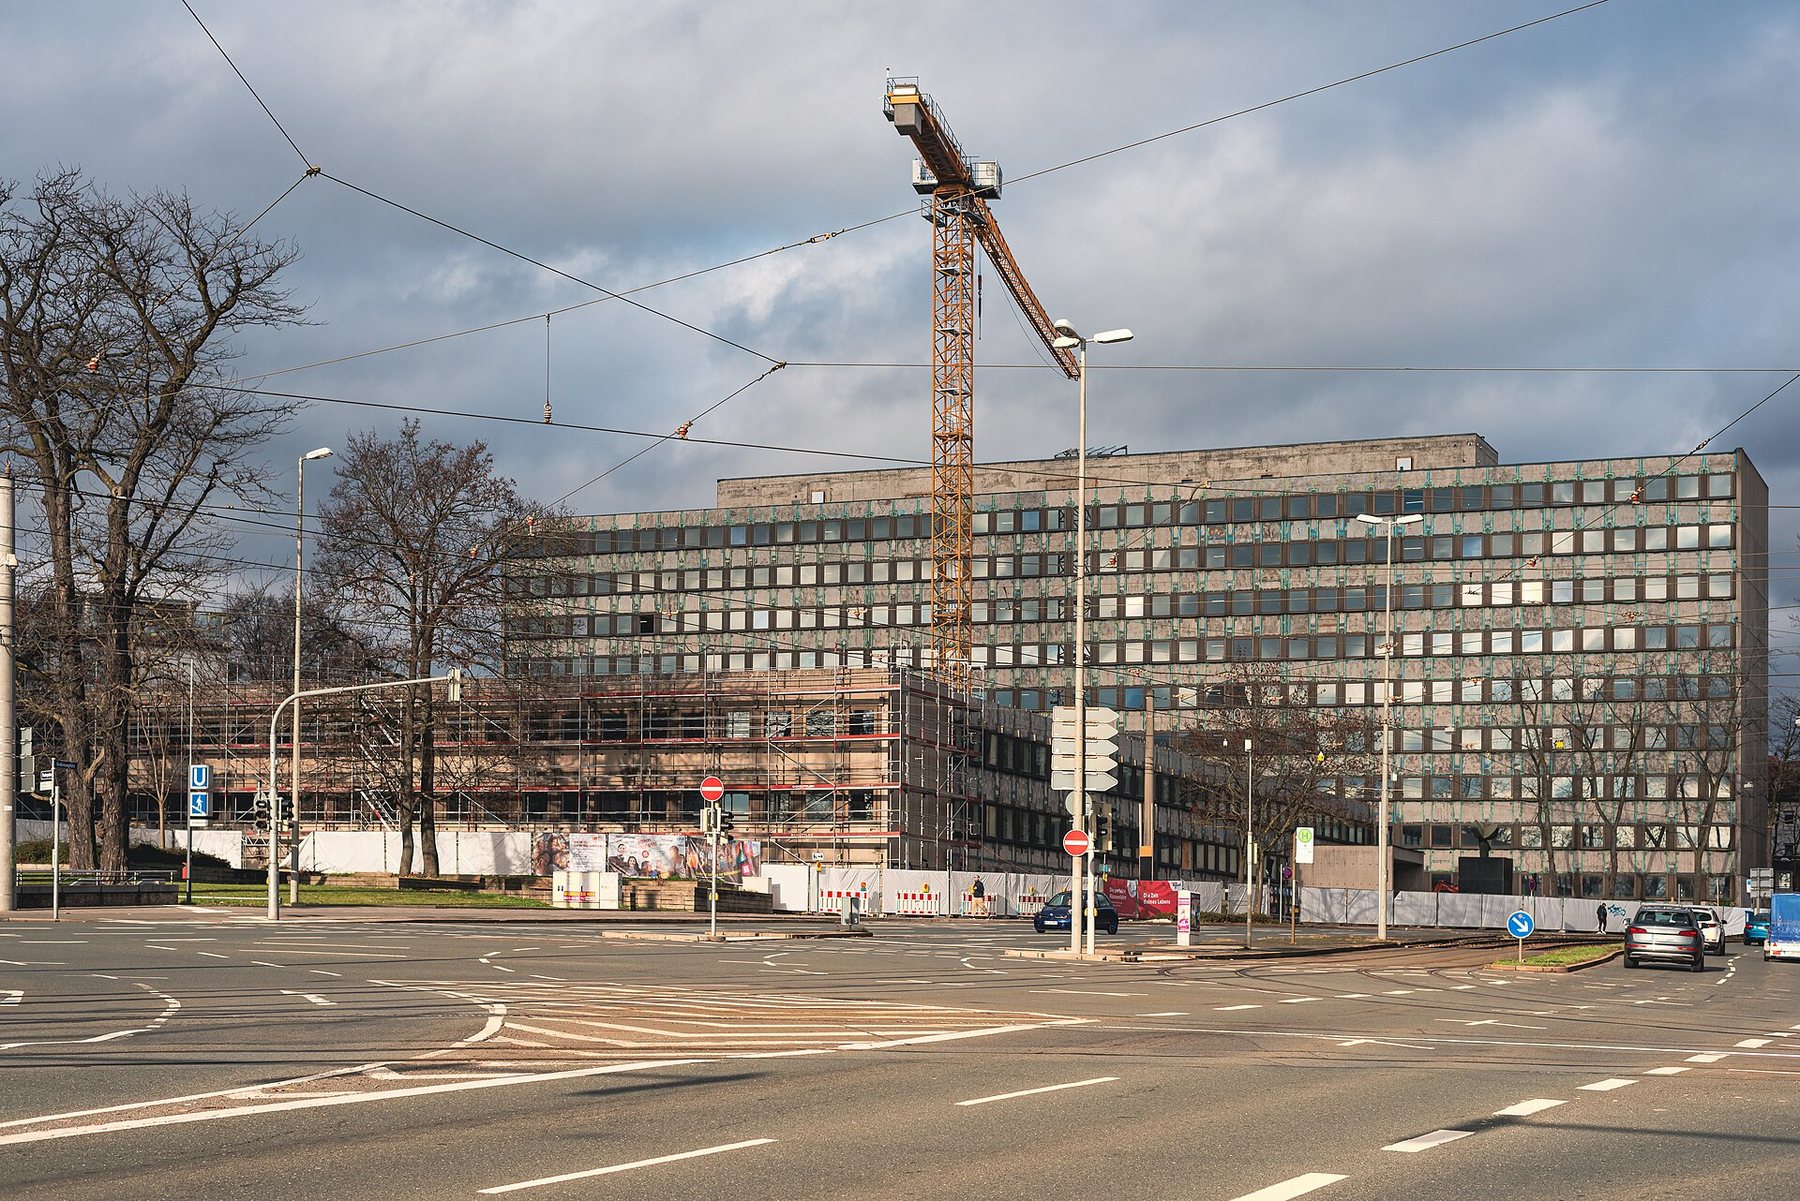
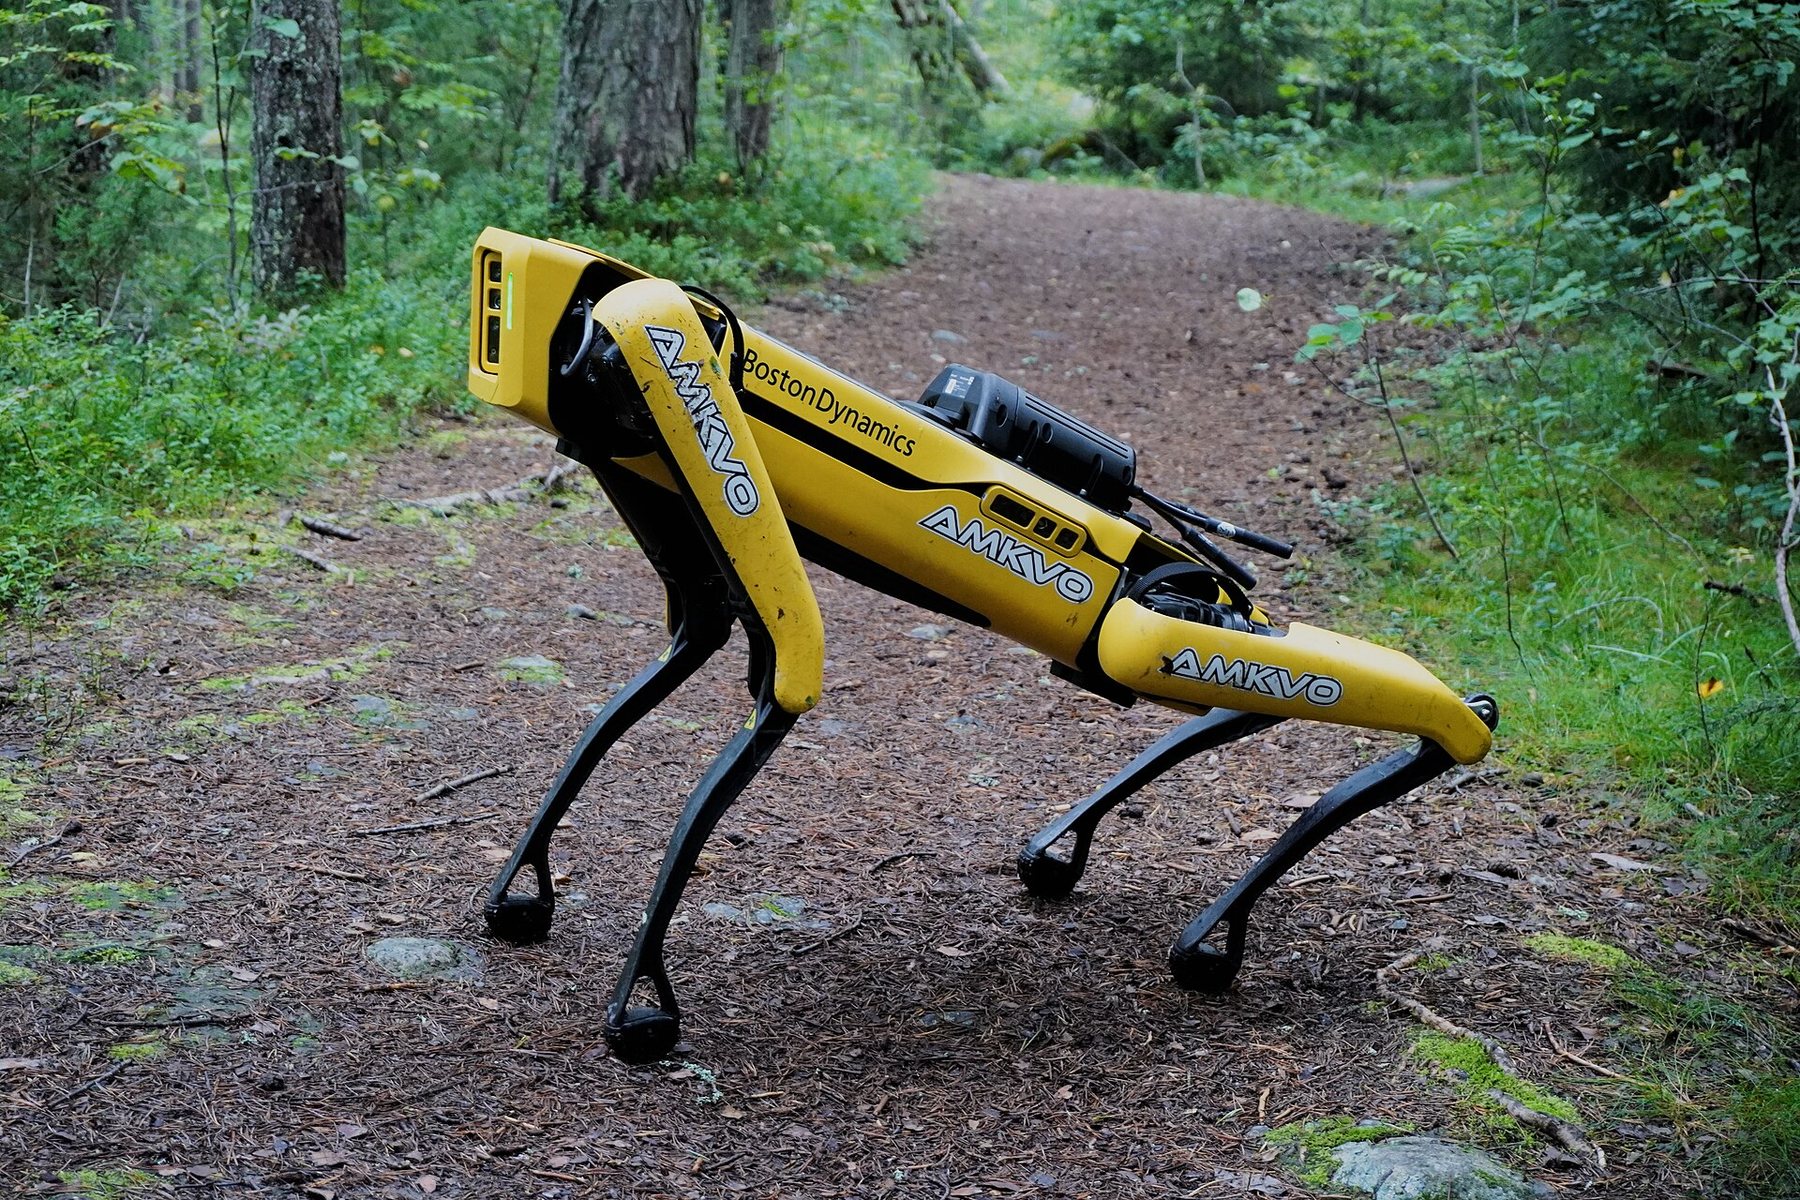
The channel decides how fast a machine reaches projects.
Talent
The people who run, repair and supervise machines.
Every robot needs a human manager.
82
The people who run the machines.
84
Skills in short supply, and their proof.
83
Every robot needs a human manager.
Talent: thesis and evidence.
490K+
FAA-certificated remote (drone) pilots, end-2025
349K
Workers construction must add in 2026
30%
More reliability and maintenance staff at Amazon’s newest sites
29.2%
Turnover of on-site apartment staff, 2025
- The scarce skills are technicians, remote pilots, integrators and supervisors.
- Talent is a cost line, a revenue line and a limit on scale.
- Humans in the lead, physical AI in the loop.
Thesis
- Amazon moves people from carrying to supervising and repairing.
- Atomgigs brings vetted contract experts to client sites.
- Training and staffing businesses that serve robot fleets are early and thinly funded.
Evidence
Scale depends on people; companies that train and retain them hold an edge. Go deeper: Primer 03 Talent.
Skills in short supply, and their proof.
Who is building, how proven, risks and signals.
- 1Who is building
Technicians and maintainers Remote pilots and fleet supervisors Integration engineers
- 2How proven
Remote pilot certification: established Robot technician pathways: early Fleet supervision roles: new
- 3Main risks
Wage inflation Slow certification Turnover Key-person dependence
- 4What to watch
Community college and union programs Technician wage trend Service attach rates Staffing models
Ask every company who runs its machines in the field, and how they are trained.
The people who run the machines.
Representative machines and sites.
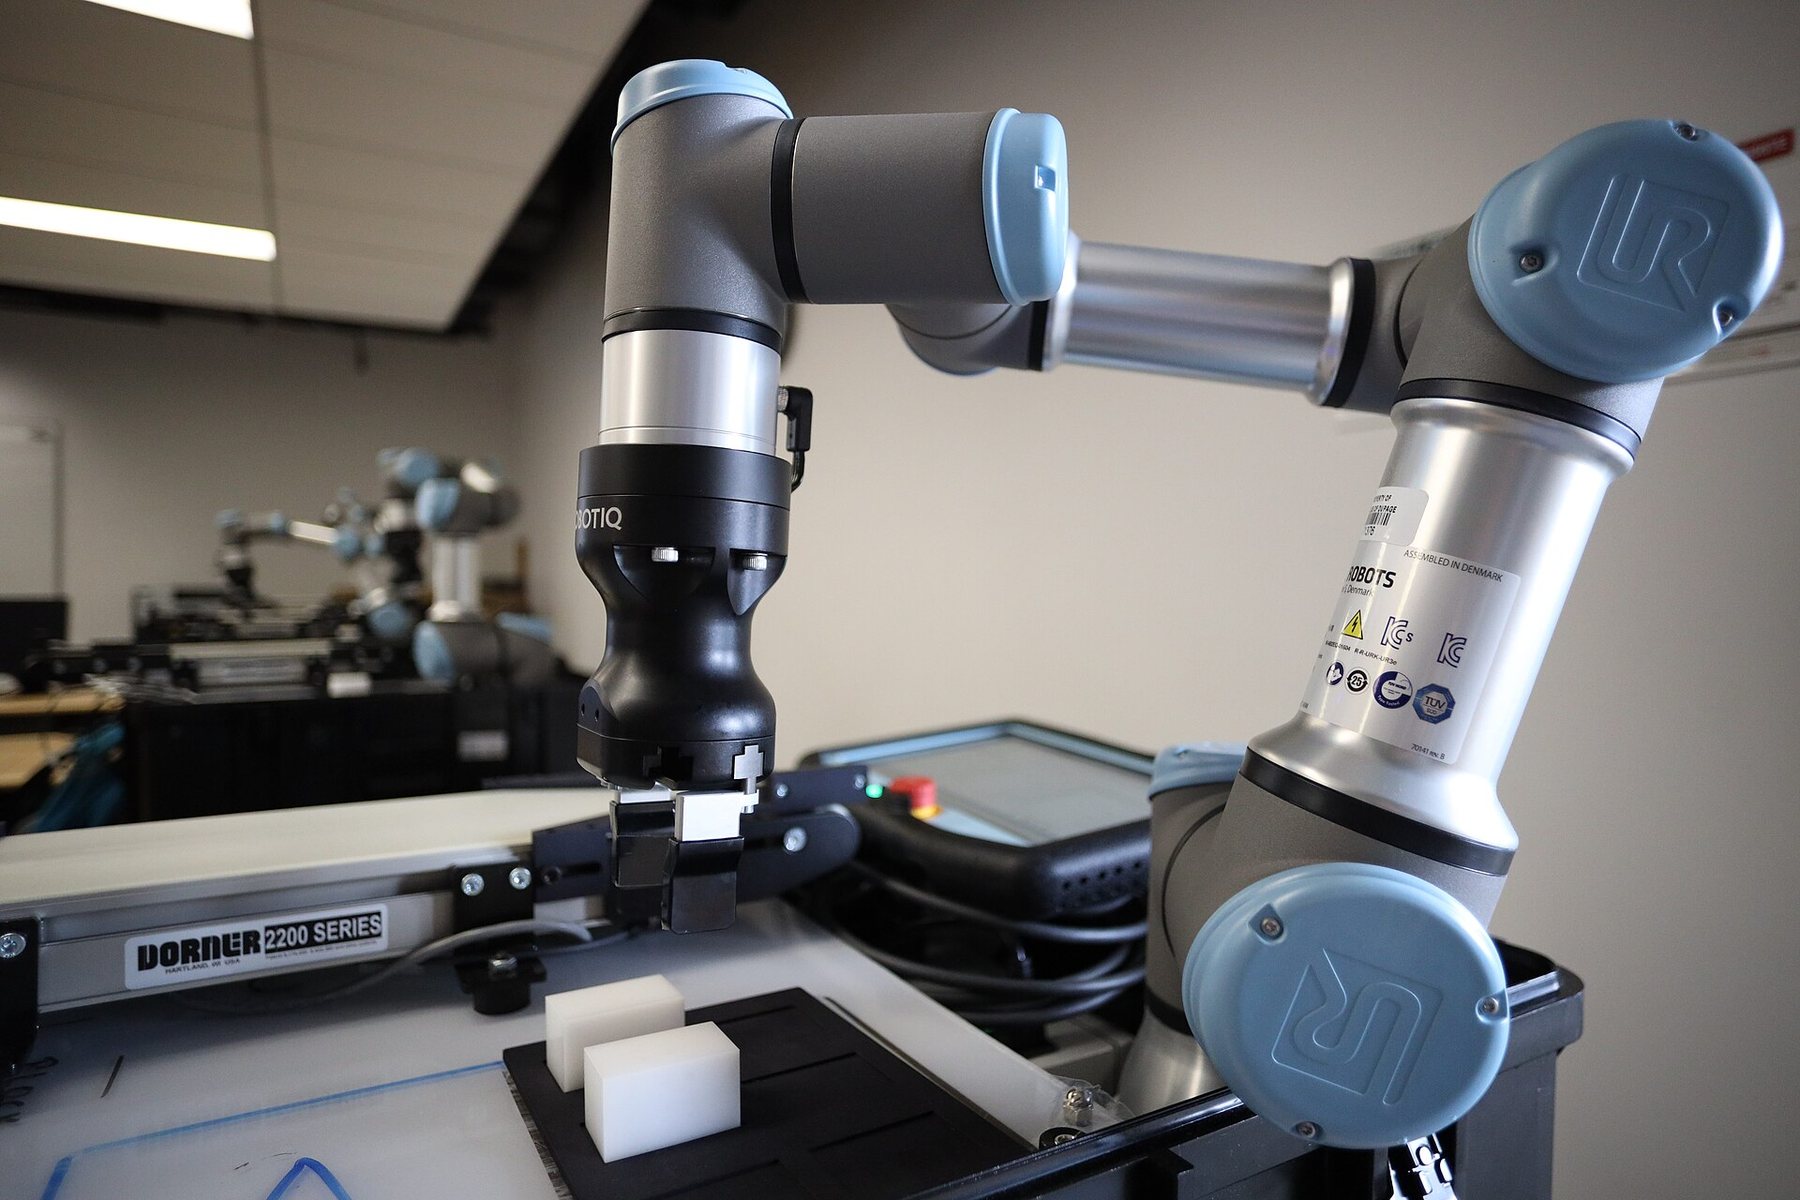

Every robot needs a human manager.
Real assets
What physical AI does to data center, industrial and infrastructure property.
Physical AI changes what property needs.
86
Property for physical AI.
88
Four questions for a real asset review.
87
Physical AI changes what property needs.
Effect on four asset types.
| Asset type | What physical AI changes | What to watch |
|---|---|---|
| Data centers | Faster, repeatable builds and robot-assisted operations | Power-ready capacity; liquid cooling |
| Industrial and logistics | Automation-ready space: clear height, floor loading, power | Tenant automation plans |
| Infrastructure | Drone inspection and predictive maintenance | Utility and public capex |
| Commercial buildings | Delivery and cleaning robots; lower service labor cost | Building access and elevator integration |
Physical AI changes what space is worth, not only who works in it.
Four questions for a real asset review.
What to ask about any property.
- 1Tenants
Are tenants automating? Which robot systems do they plan? Do leases allow machines?
- 2Building
Clear heights and floor loads Doors, elevators and charging space Network coverage
- 3Power
Capacity for charging and equipment Backup and resilience Utility lead times
- 4Operations
Who runs the machines? Service and uptime terms Insurance and liability
Four questions bring physical AI into an ordinary asset review.
Property for physical AI.
Representative machines and sites.
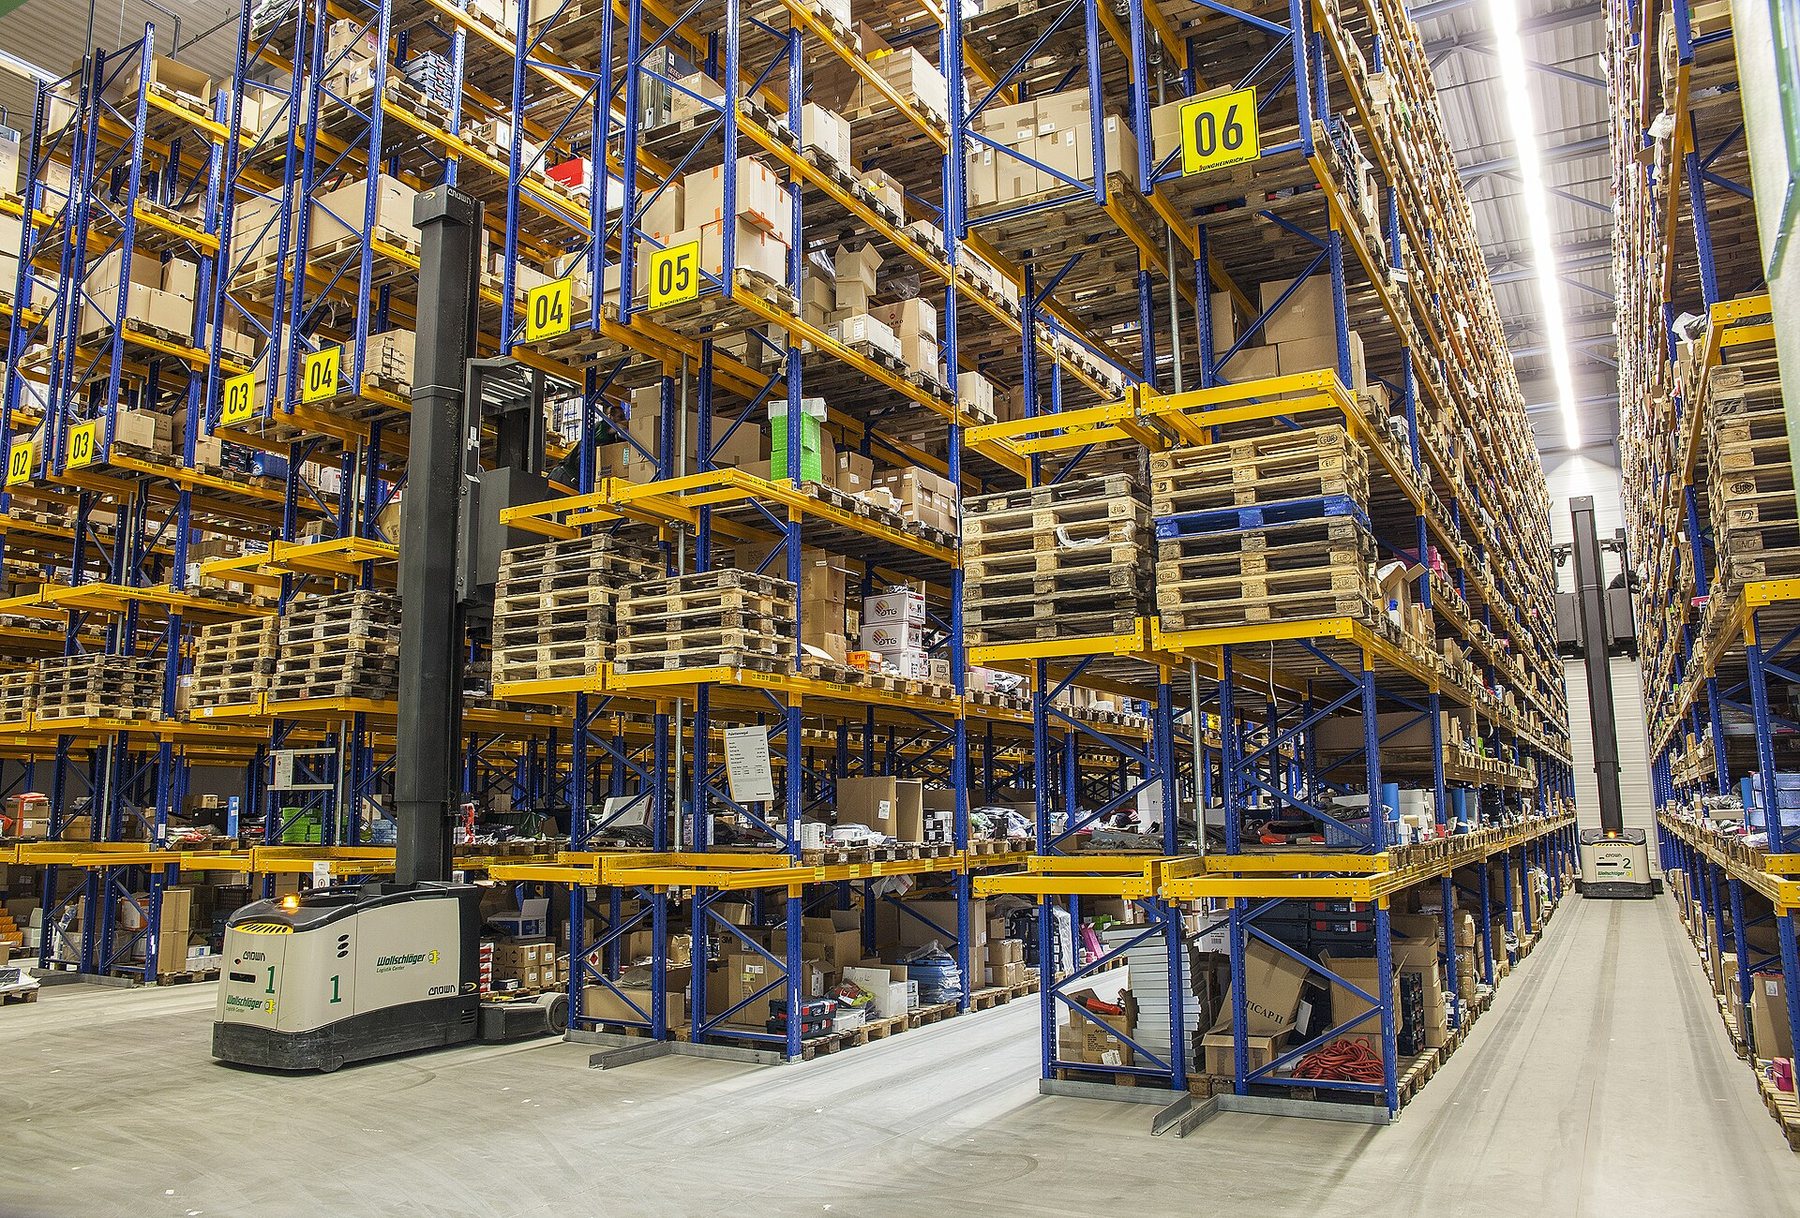
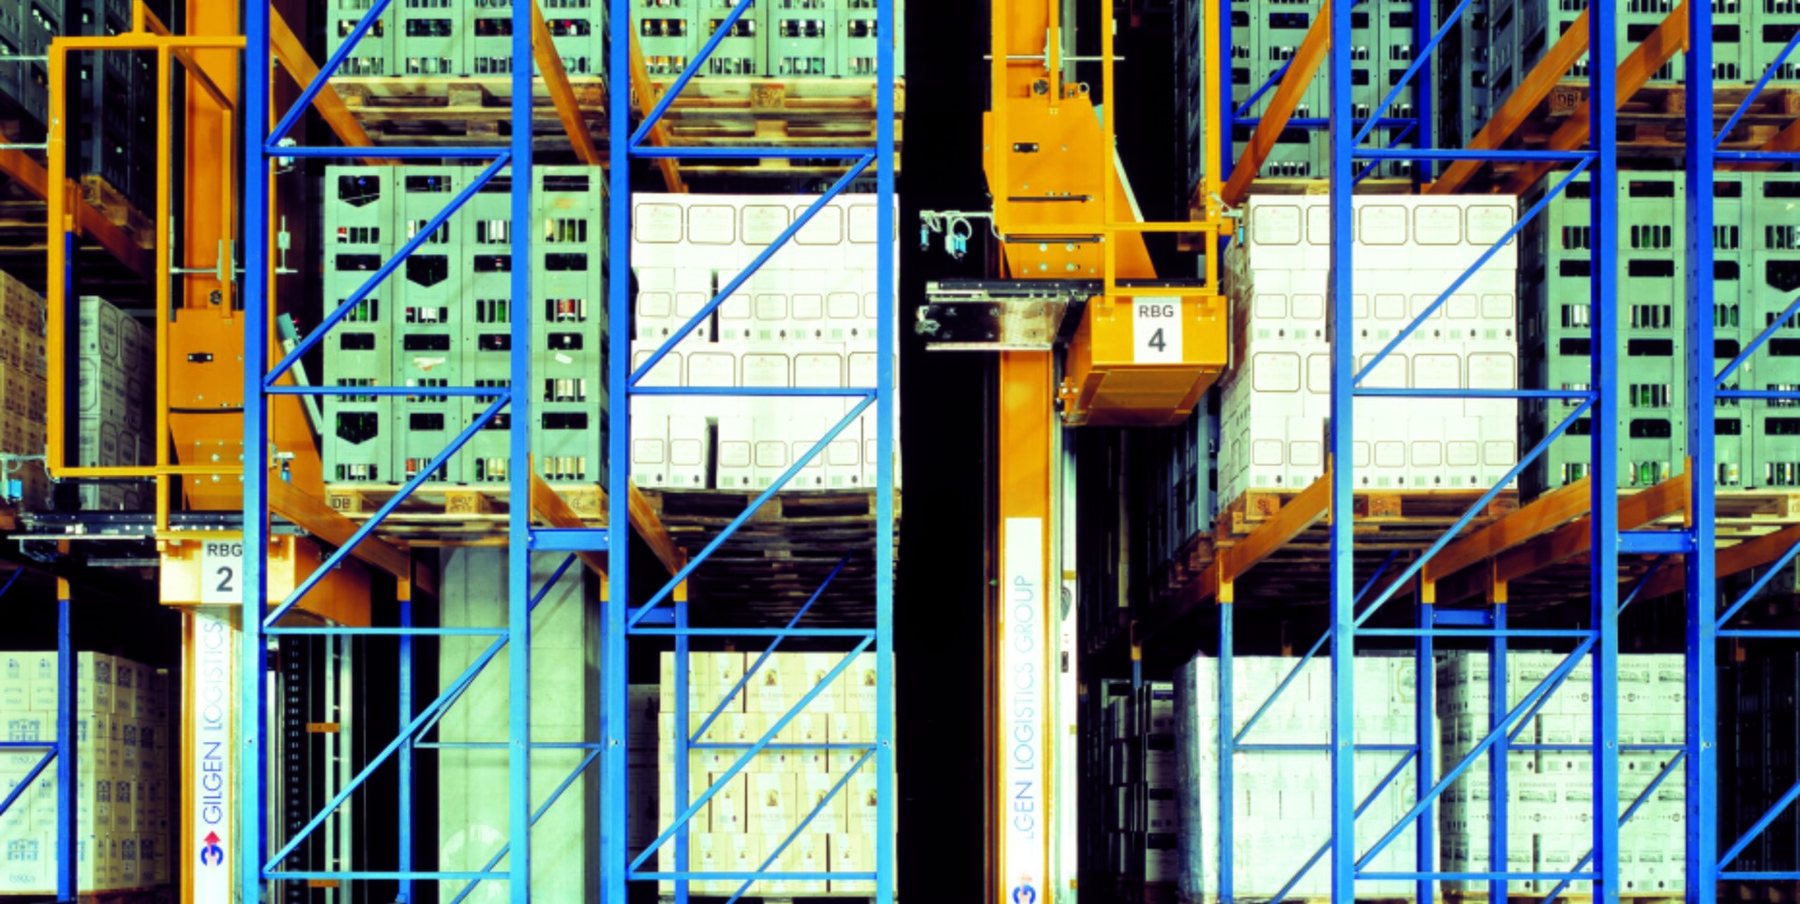
Physical AI changes what a property needs.
Finding the right investments
Before the deal, the diligence framework, scorecards, sample deliverables, how an engagement runs.
Before the deal
Five jobs Atomgigs does ahead of an investment, and why field evidence matters.
Five jobs before the deal.
91
Field evidence separates deals that look alike.
92
Five jobs before the deal.
What Atomgigs does ahead of an investment.
- 1Find
Market maps by use case and proof level Long lists and short lists
- 2Size
Market and unit economics models Thesis building
- 3Diligence
Technology readiness Commercial, safety and supply chain review
- 4Validate
Site visits and customer reference checks Pilot data
- 5Decide
Memo for your committee Negotiation points and risks
Five jobs take you from a sector thesis to a decision your committee can defend.
Field evidence separates deals that look alike.
Why Atomgigs validates in the field.
Customer sites for Agility’s Digit
$1.8M
Agility revenue at SPAC announcement
$2.5B
Agility pre-money value
2.3x
ABB Robotics deal price, times revenue
- Demos, pipelines and letters of intent.
- Revenue and forecasts as the company states them.
- Capacity on paper.
What a data room shows
- Hours run, uptime and interventions at each site.
- How customers describe the machine and the service.
- Cost to install and keep it running.
What the field shows
Field evidence turns an option into numbers: units, utilization and margin.
The diligence framework
Ten dimensions, the proof scale and the unit economics test.
Ten dimensions of diligence, part one.
94
The unit economics test.
96
Ten dimensions of diligence, part two.
95
One proof scale for every company.
97
Ten dimensions of diligence, part one.
Market, technology, field proof, economics and service.
| Dimension | The question | Evidence gathered |
|---|---|---|
| Market | Is the buyer group large, reachable and growing? | Segment sizing, buyer interviews |
| Technology readiness | Does it work outside the lab? | Test data, failure logs, demos on site |
| Field proof | Is it paid and in daily use? | Site visits, customer references |
| Unit economics and payback | Does a machine earn more than it costs? | Cost per hour, utilization, margin by line |
| Deployment and service burden | What does it take to keep it running? | Install time, staff, spares, remote support |
Five dimensions test whether the product works and earns.
Ten dimensions of diligence, part two.
Safety, supply chain, team, concentration and position.
| Dimension | The question | Evidence gathered |
|---|---|---|
| Safety and certification | Can it be sold and insured where it runs? | Standards status, incident log |
| Supply chain and tariffs | Can parts keep flowing at a stable cost? | Bill of materials, source map, second sources |
| Team | Can this team scale from pilot to fleet? | Experience, hiring plan, key-person risk |
| Customer concentration | What if the largest buyer leaves? | Revenue by customer and contract term |
| Competitive position | Why does this company win? | Win and loss reviews, pricing, switching cost |
Five more dimensions test whether the company can scale and defend its position.
The unit economics test.
Break-even in five steps, with an illustration. Typical ballpark values, not quotes.
- 1Cost per year
Robot, service, software, charging. Example: $60,000
- 2Loaded wage
Fully loaded labor cost an hour. Example: $40
- 3Break-even hours
Cost ÷ wage. Example: 1,500 hours
- 4Utilization
Hours run ÷ hours available. Example: 1,500 ÷ 4,000 = 38%
- 5Payback
Months of savings to repay the cost. Measured, not claimed
A machine pays back when it works enough hours; every model should show utilization by site.
One proof scale for every company.
Five levels from scaled to concept.
| Proof level | What it means | What investors look at |
|---|---|---|
| Scaled | Thousands of units in paying use | Volume and margin |
| Commercial | Paying customers at many sites | Utilization and service |
| Early commercial | A few paying customers and clear repeats | Conversion from pilot to paid use |
| Pilot | Trials under way; limited paid use | Milestones; treated as an option |
| Concept | Demos and pre-orders only | Research-stage evidence only |
One proof scale lets a committee compare an arm maker and a humanoid maker fairly.
Scorecards
A five-point scale and a sample scorecard.
A five-point scale for every dimension.
99
A sample scorecard.
100
A five-point scale for every dimension.
How each dimension is scored.
| Score | Meaning | Typical evidence |
|---|---|---|
| 5 | Strong and proven | Repeat paying use at several sites |
| 4 | Good with minor gaps | Paying use with some open items |
| 3 | Adequate, needs work | Pilot data and a credible plan |
| 2 | Weak | Claims without field data |
| 1 | Fails the test | Contradicted by evidence |
A simple scale keeps ten dimensions comparable across companies.
A sample scorecard.
Fictional company and data.
| Dimension | Score | Evidence note |
|---|---|---|
| Market | 4 | Large buyer group; two segments reachable |
| Technology readiness | 3 | Works in two sites; one failure mode open |
| Field proof | 3 | Five sites, two paid in daily use |
| Unit economics | 2 | Payback depends on 60% utilization |
| Deployment burden | 3 | Install takes six weeks per site |
| Safety and certification | 4 | Standard met; certificate in hand |
| Supply chain | 2 | Single source for actuators |
| Team | 4 | Experienced founders; thin service bench |
| Customer concentration | 2 | One buyer is 55% of revenue |
| Competitive position | 3 | Strong software; hardware easily copied |
Sample scorecard for a fictional company: low scores point to the diligence questions to press.
Sample deliverables
A market map, a diligence memo and a field validation report.
A sample market map.
102
A sample field validation report.
104
A sample diligence memo.
103
A sample market map.
Fictional companies placed by segment and proof level.
- 1Robot intelligence
Company A: early Company B: pilot Company C: pilot
- 2Humanoids
Company D: pilot Company E: pilot Company F: concept
- 3Warehouse systems
Company G: commercial Company H: commercial Company I: early commercial
- 4Operations and integration
Company J: early commercial Company K: early Company L: early
Sample market map with fictional names: each company placed by segment and proof level.
A sample diligence memo.
Six sections.
| Memo section | What it holds |
|---|---|
| Key findings | The main findings and the three points behind them |
| Market and thesis | Buyer segments, size and growth |
| Product and proof | Readiness, field results, proof level |
| Economics | Unit economics, utilization, margin by line |
| Risks and mitigants | Safety, supply, concentration, team |
| Terms and next steps | Open items to settle before closing |
The memo gives your committee the evidence for its decision, not a data dump.
A sample field validation report.
Fictional company and data.
| Site | Robots | Hours a day | Uptime | Customer comment |
|---|---|---|---|---|
| Site 1, warehouse | 12 | 16 | 96% | Reliable; wants faster pick rate |
| Site 2, warehouse | 8 | 9 | 91% | Needs better exception handling |
| Site 3, plant | 4 | 6 | 88% | Two stops a week; service slow |
| Site 4, hospital | 6 | 12 | 94% | Staff like it; wants more routes |
| What the report concludes | ||||
| Utilization is 50% across the 30 robots (hours a day ÷ 24); payback holds above 60%. The service model is the gap. | ||||
Sample report with fictional data: it ties what customers say to hours and uptime.
How an engagement runs
From scope to report, with the people involved.
A diligence engagement in five steps.
106
What you receive and who does the work.
107
A diligence engagement in five steps.
Typical timing; scope sets the actual schedule.
- 1Scope
Agree questions, scope and timing. Week 1
- 2Screen
Market map and short list. Weeks 1 to 2
- 3Diligence
Technical, commercial and economics review. Weeks 2 to 5
- 4Field validation
Site visits and customer reference checks. Weeks 4 to 6
- 5Report
Memo, scorecard and committee support. Weeks 6 to 7
A typical engagement runs six to eight weeks; scope sets the timing.
What you receive and who does the work.
Deliverables and team.
- Market map and short list.
- Diligence memo and scorecard.
- Field validation and reference report.
- Briefing for your committee.
What you receive
- A senior lead with M&A and operating experience.
- Engineers who test the technology.
- Field contacts at buyers and clients.
Who works on it
You get one team, one set of answers and a report your committee can use.
Keeping track of what you own
Tracking framework, reporting and early warning, market intelligence, value creation, platforms, m&a and exits.
Tracking framework
Why monitoring physical AI is different and what to measure by company type.
Machines in use tell you more than logos.
110
Metrics by company type.
111
Machines in use tell you more than logos.
Why monitoring physical AI is different.
- Revenue follows machines in use, not contracts signed.
- Utilization and uptime move before revenue does.
- Service and integration costs surface late.
What changes with physical AI
- Deployments, utilization and uptime by site.
- Revenue per machine and margin by line.
- Backlog, cash runway and milestones.
What Atomgigs tracks
Field metrics lead financial metrics by a quarter or more.
Metrics by company type.
Lead metrics and early warnings.
| Company type | Lead metrics | Early warning |
|---|---|---|
| Robot and drone makers | Units shipped, deployments, gross margin | Margin stuck, pilots not converting |
| Robots-as-a-service operators | Utilization, revenue per robot, uptime | Idle machines, rising service cost |
| Integrators and service firms | Backlog, hours per site, margin | Overruns, technician turnover |
| Fleet software | Fleet size, recurring revenue, retention | Customer churn, flat fleet |
| Data center and infrastructure assets | Preleasing, power delivered, cost per MW | Power delays, tenant concentration |
Track the metrics that fit the business model, not one template.
Reporting and early warning
Cadence, a sample dashboard and the flags that matter.
Four reporting rhythms.
113
Six early-warning flags.
115
A sample dashboard.
114
Four reporting rhythms.
Cadence for monitoring.
- 1Weekly
Signals: deployments, news, risk flags. Short note.
- 2Monthly
Dashboard: KPIs against plan. For the deal team.
- 3Quarterly
Committee pack: performance, risks, actions. Plus market update.
- 4Annually
Review: thesis check and exit options. Findings for the committee.
Four cadences keep your committee informed without flooding it.
A sample dashboard.
Fictional company and data.
94%
Fleet uptime, month
52%
Average utilization
$410K
Revenue per site, month
14 mo
Cash runway
| Measure | Plan | Actual | Flag |
|---|---|---|---|
| Active sites | 12 | 10 | Amber: two installs slipped |
| Gross margin | 28% | 24% | Amber: service cost |
| Backlog | $18M | $21M | Green |
Sample dashboard with fictional data: plan, actual and a flag for each measure.
Six early-warning flags.
Triggers and meaning.
| Flag | Trigger | What it means |
|---|---|---|
| Pilot purgatory | Pilots over six months with no paid rollout | Product or buyer fit problem |
| Idle machines | Utilization below plan two months running | Revenue at risk |
| Margin slip | Gross margin down two quarters | Service or parts cost |
| Concentration | One customer above 40% of revenue | Contract risk |
| Cash | Runway under nine months | Financing or cost action needed |
| Safety event | Any reportable incident | Deployment may stop |
Flags tell the committee early, while action is still cheap.
Market intelligence
What is hot, what is cooling and what is coming.
Hot, cooling and coming.
117
Intelligence from the field.
118
Hot, cooling and coming.
Market intelligence themes.
- Defense and dual-use autonomy
- Data center build-out
- Robot intelligence rounds
What is hot
- Consumer and companion robots
- Hardware-only models with thin margins
- Pilots without paid rollouts
What is cooling
- Public listings: Unitree and Agility now listed
- Strategic consolidation
- Robots as a service at scale
What is coming
Intelligence is useful when it changes how your committee reads its holdings.
Intelligence from the field.
Where it comes from and what you get.
- Pilots and field work at buyers and clients.
- Contacts at makers, contractors and operators.
- Funding, deal and regulatory tracking.
How Atomgigs knows
- A monthly market note by sector.
- Alerts on deals, rules and failures.
- Briefings before investment committee meetings.
What you receive
The field network turns news into signals that matter to your holdings.
Value creation
Five levers and the board or observer role.
Five ways to add value.
120
Board and observer roles.
121
Five ways to add value.
Operating support.
- 1Clients
Introductions to buyers who need the product
- 2Channel partners
Contractors and integrators who deliver it
- 3Talent
Technicians, pilots and supervisors
- 4Suppliers
Components, service and second sources
- 5Pilots
Paid pilots that prove the case
Five levers move a company from pilot to fleet.
Board and observer roles.
Two ways to stay close.
- Governance and strategy.
- Monthly operating review.
- Introductions and hiring help.
Board seat
- Attend meetings and review reports.
- Advise on pilots, channel and talent.
- No vote; lighter time commitment.
Observer or adviser role
Roles are set case by case, with the board and your investment team.
Platforms, M&A and exits
Roll-ups, exit readiness and support.
Platforms, roll-ups and exits.
123
Exit and M&A support.
125
Exit readiness.
124
Platforms, roll-ups and exits.
Routes to scale.
- 1Platform
One company adds services and products
- 2Roll-up
Combine integrators or operators for scale
- 3Strategic partner
A buyer with a platform thesis
- 4Public listing
IPO or SPAC when scale and revenue support it
Four routes to a larger company or an exit.
Exit readiness.
What buyers look for.
| Readiness item | What buyers look for | Atomgigs help |
|---|---|---|
| Deployments | Machines running at paying sites | Reference checks |
| Recurring revenue | Service, software, RaaS contracts | Contract review |
| Margin | Clear path to margin by line | Model review |
| Team | Operators able to run at scale | Hiring support |
| Data room | Clean metrics and contracts | Preparation |
Exit readiness is built over years, not months.
Exit and M&A support.
Experience behind the support.
$20B+
M&A deal value facilitated
Years in management consulting
Years focused deeply on M&A
$100M+
Business impact delivered
- Buyer lists and outreach.
- Positioning and materials.
- Process management to close.
Exit support
- A field network buyers recognize.
- M&A depth from a long record.
- An engineering background that reads the technology.
Atomgigs strengths
M&A experience is applied to physical AI exits and consolidation.
Working with Atomgigs
Engagement models, independence and confidentiality, how an engagement starts, why Atomgigs.
Engagement models
Four ways to work together.
Four ways to engage.
128
Consulting, not investment advice.
129
Four ways to engage.
Engagement models in plain terms.
- 1Advisory retainer
Ongoing access to the team Market intelligence and portfolio monitoring Monthly rhythm
- 2Project
Fixed scope and timing Diligence, market map or field validation One report
- 3Board or observer role
Seat at the table Governance and operating support Agreed with the company
- 4Milestone-linked
Part of the advisory fee tied to agreed milestones Milestones set in the written scope Agreed up front
Models can be combined; scope and terms are agreed before work starts.
Consulting, not investment advice.
Roles and licensing.
- Atomgigs provides consulting and field evidence.
- Your team makes every investment decision.
- Atomgigs is not a registered investment adviser.
How Atomgigs works
- Atomgigs works alongside a licensed adviser or counsel.
- A licensed professional is brought in for the engagement.
- Roles are written into the engagement terms.
Where a license is required
Clear roles keep consulting separate from investment advice.
Independence and confidentiality
How Atomgigs works with your team.
Principles for every engagement.
131
Principles for every engagement.
Confidentiality, conflicts, independence and ownership.
- 1Confidentiality
Agreement before any deal information is shared Need-to-know team
- 2Conflicts
Interests disclosed up front Clear rules on client overlap
- 3Independence
Findings follow the evidence Honest ratings, including low scores
- 4Ownership
You own the deliverables made for you
Investors share sensitive information; the terms protect it.
How an engagement starts
Five steps from first call to first deliverable.
How an engagement starts.
133
What happens before kickoff.
134
How an engagement starts.
Five steps.
- 1Intro call
Your thesis, sectors and questions.
- 2Scope
Questions, deliverables and timing.
- 3Agreement
Terms and confidentiality.
- 4Kickoff
Team, data and access.
- 5First deliverable
Market map or first dashboard.
A first deliverable arrives within weeks.
What happens before kickoff.
Preparing together.
- Your investment focus and sectors.
- The decision you face.
- Who needs to see the result.
First call
- Written scope and timing.
- Agreed team and access.
- Confidentiality in place.
Before kickoff
Clear scope first, then work.
Why Atomgigs
Field network, team and experience.
What sits behind Atomgigs.
136
Experience behind the team.
137
What sits behind Atomgigs.
Four strengths.
- 1Senior pod
Leaders with operating and deal experience A named lead for your account
- 2Field network
Makers, buyers and clients Contractors and integrators
- 3Vetted contract experts
Technicians, pilots and engineers Available to test and validate
- 4M&A depth
A long record of transactions Exit and consolidation support
Humans in the lead, physical AI in the loop: the same principle runs through our own work.
Experience behind the team.
Headline credentials.
$20B+
M&A deal value facilitated
Years in management consulting
Years focused deeply on M&A
$100M+
Business impact delivered
- Electrical and electronics engineering.
- Consulting and C-suite operating roles.
- M&A across many industries.
Background
- Technology read by someone who builds.
- Deals read by someone who has closed them.
- One senior contact for the engagement.
What it means for you
Engineering and M&A experience in one team.
Outlook and ten things to remember
Outlook, key takeaways and next steps.
Outlook
Signals to watch and a maturity map.
Four signals to watch.
140
A maturity map.
141
Four signals to watch.
Outlook as signals, not forecasts.
- 1Capital
Mega-round concentration Mid-market funding Debt-funded build
- 2Deployment
Paid sites for humanoids Utilization data Service attach
- 3Rules
Drone and VTOL rules Safety standards for new robots State data center laws
- 4Exits
More listings Strategic buyers Consolidation
Four signals show whether proof is catching up with capital.
A maturity map.
Proof by sector.
| Sector | Proof level | Why |
|---|---|---|
| Industrial arms | Scaled | 603K installed in 2025 |
| Warehouse systems | Commercial | Amazon 1M+ robots; Symbotic backlog |
| Drone survey and inspection | Commercial | Routine use |
| Service robots | Commercial | ~250K shipped in 2025 |
| Construction machines | Early commercial | Few vendors at scale |
| Humanoids | Pilot | Few paying sites |
| Passenger VTOL | Early | Certification in progress |
Maturity differs by a wide margin; do not treat physical AI as one market.
Key takeaways and next steps
Ten things to remember and how to start.
Ten things to remember.
143
Go deeper.
145
How to start.
144
Ten things to remember.
Key takeaways.
Capital has arrived
$27B+ in Jan–Sep 2026, above any prior full year.
The pace is rising
$9.9B in Q3 2026, against $4.3B a year earlier.
Proof trails money
Humanoids have few paying sites.
Utilization decides
Machines pay back only if they work enough hours.
Services and people matter
Deployment succeeds or fails on service and talent.
Mid-market is thin
Ten companies took over 40% of 2025 funding.
Field evidence beats demos
Sites, hours and uptime show the truth.
Track machines, not logos
Deployments and utilization lead revenue.
Exits are open
Listings, SPACs and strategic sales are all active.
Consulting, not advice
Atomgigs supports your team; you decide.
How to start.
A first conversation.
- A thesis review for one sector.
- A diligence on one company.
- Monitoring for your current holdings.
Where to start
- atomgigs.com
- [email protected]
- +1-310-694-4750
Reach Atomgigs
Start with one question and one deliverable.
Go deeper.
The other Atomgigs primers, one address each.
| # | Primer | Address | What it covers |
|---|---|---|---|
| 00 | Value Proposition | atomgigs.com | How Atomgigs works and who it serves. |
| 01 | Robotics | atomgigs.com/robots | Every robot type: makers, proof and economics. |
| 02 | OEMs, Drones and VTOL | atomgigs.com/oems | Drones, VTOL, IoT and automation makers. |
| 03 | Talent | atomgigs.com/talent | The experts who run, repair and supervise machines. |
| 05 | Enablers | atomgigs.com/enablers | Financing, insurance, platforms and standards. |
| 06 | Channel Partners | atomgigs.com/channel-partners | Contractors and integrators who take machines to projects. |
| 07 | Data Centers | atomgigs.com/data-center | How data centers are built, run and paid for. |
| 08 | Manufacturing and Logistics | atomgigs.com/manufacturing | How goods are made, stored and moved. |
| 09 | Construction and Infrastructure | atomgigs.com/construction | How we build and run the physical world. |
| 10 | Public Safety and Defense | atomgigs.com/public-safety | Machines that extend public safety and defense teams. No weapons. |
| 11 | Commercial Services | atomgigs.com/commercial | Robots and drones in service businesses. |
| 12 | Physical AI Labs | atomgigs.com/labs | Real-site data for training robots. |
| 13 | Physical AI Technology | atomgigs.com/technology | Compute, sensing, control, AI models, simulation and deployment. |
About us and notes
The primers, Atomgigs, Mavengigs, Monty Pandey, notes.
The primers, one address each
Every primer is readable on atomgigs.com or in presentation mode.
| # | Primer | Address | What it promises |
|---|---|---|---|
| 00 | Value Proposition | atomgigs.com | Why Atomgigs, and how it works. |
| 01 | Robotics | atomgigs.com/robots | Every robot type, for every application. |
| 02 | OEMs, Drones and VTOL | atomgigs.com/oems | Everything that helps people work in the physical world, other than robots. |
| 03 | Talent | atomgigs.com/talent | The experts who work alongside physical AI. |
| 04 | Investors | atomgigs.com/investors | Where physical AI capital is going, and how to find and track deals. |
| 05 | Enablers | atomgigs.com/enablers | The organizations that pay for, insure, run and approve machines at work. |
| 06 | Channel Partners | atomgigs.com/channel-partners | Winning and delivering projects with physical AI. |
| 07 | Data Centers | atomgigs.com/data-center | How data centers are built, run and paid for, and who buys them. |
| 08 | Manufacturing and Logistics | atomgigs.com/manufacturing | How goods are made, stored and moved. |
| 09 | Construction and Infrastructure | atomgigs.com/construction | How we build and run the physical world. |
| 10 | Public Safety and Defense | atomgigs.com/public-safety | Extending public safety and defense teams with machines. No weapons. |
| 11 | Commercial Services | atomgigs.com/commercial | Where robots, drones and automation work in service businesses. |
| 12 | Physical AI Labs | atomgigs.com/labs | Physical AI data for training robots, only with customer approval. |
| 13 | Physical AI Technology | atomgigs.com/technology | The stack behind robots, from silicon to fleet. |
Atomgigs: Physical AI Delivered as Jobs Done
Machines and people as one hybrid workforce, to scale up what you build and run. Primers hold the details.
What Atomgigs is
- Robots, drones, VTOL, IoT and automation, with people, as one hybrid workforce.
- Humans in the lead, physical AI in the loop.
- Not a machine builder: it sources from makers, then staffs, integrates, deploys and operates.
The sources
- Robots: every robot type, profiled in depth.
- Everything other than robots: drones, VTOL, IoT and automation, from many makers.
- The humans: role families across the trades, engineering and safety, every person a contractor.
Who we work with
- Investors: consulting before and after the deal.
- Enablers: financiers, insurers, platforms and regulators behind every deal.
- Channel partners: engineering, design, MEP and construction firms.
Buyer groups
- Data centers
- Manufacturing and logistics
- Construction and infrastructure
- Public safety and defense (no weapons)
- Commercial services
- Physical AI labs
How it works
- Consulting engagement, then a short pilot, then production.
- One scope, one site, one metric in the pilot.
- A small senior pod runs every site, with a named human manager for every robot.
How we are paid
- Pilot, managed crew, outcome-based or advisory.
- No capital outlay for machines and no long-term headcount.
- Pay for capacity and outcomes; scale up as results are proven.
Atomgigs is a Mavengigs venture. Atomgigs is a division of Panvisage Inc.
Mavengigs: the Scale Up Guys
Consulting, Capital and Ventures.
Mavengigs Consulting
- Strategic M&A, transformation and optimization
- Focused on the part of M&A that begins after everyone shakes hands
- Built for PE-backed and Fortune 500 teams
Mavengigs Capital
- An independent sponsor platform
- Family office strategy and management
Mavengigs Ventures
- Funding and mentorship for founders we back
- Panmedical: digital health in India, run as CEO
- Atomgigs, Mavens Life and Mavens Health
Mavengigs is a division of Panvisage Inc.
Monty Pandey: Founder and CEO
Founder, CEO and driving force behind Atomgigs

Career and experience
- 30+ years of management consulting: managed major M&A deals totaling $20 billion; scaled 50+ companies for $100 million of impact
- Deep expertise in M&A consulting, including integrations and divestitures
- 2018 to present: Mavengigs: Consulting, Capital and Ventures
- 2004 to present: Founded Panvisage, CEO for 22 years
- 2024 to present: Panmedical CEO (digital health)
- 1998 to 2004: Oracle, led 14 enterprise programs
- 1994 to 1996: Rolled out nationwide cell networks
- 1992 to 1994: Car and truck design (CAD, CAM, CIM)
- 1991: B.E. Electrical and Electronics Engineering
- 1989 to 1991: Designed robots, AGVs and manufacturing transfer lines
- Data centers: built one from scratch in 2000; data center migration in 2008; Equinix in 2020
- E&C companies: WSP, Jacobs, Worley, Halliburton, Fluor, Brown & Root
- Managed the buildout of a manufacturing plant and a distribution center
Monty Pandey
- Founder and CEO, Atomgigs
- Founder and CEO, Mavengigs
- Co-founder and CEO, Panmedical
| Selected transactions | Value | Role |
|---|---|---|
| GE Appliances / Haier | $5.6B | Readied for sale |
| Jacobs / CH2M / Worley | $3.3B | Integration, Divestiture |
| ITW Signode / Carlyle | $3.2B | Carve-out, then sale |
| AMLI / Morgan Stanley | $2.1B | Take-private |
| Fortune Brands / ACCO / GBC | $2B | Divestiture, Integration |
| Equinix / Packet | $335M | Integration |
Notes on use
Three things to keep in mind when reading this deck.
Not investment advice
Atomgigs provides consulting. We are not an investment advisor, so you make your own decisions on investments.
Products belong to their owners
Company, product and robot names, logos and photos are used as examples and belong to their owners. This deck is for information only and is not a contract or an offer.
About the numbers
Numbers come from publicly available sources and are the latest available at publication. Costs, prices and returns are typical ballpark values, not quotes; they will be updated for your specific engagement.
Visual guide and reference
Diagrams, glossary, quick reference.
Diagrams
The stack, the proof ladder and the life cycle.
The physical AI stack.
154
The investment life cycle.
156
The proof ladder.
155
The physical AI stack.
Five layers.
- 1Sense
Cameras, LiDAR, sensors
- 2Connect
Wi-Fi, 5G, satellite
- 3Decide
Edge and cloud AI, fleet software
- 4Act
Robots, drones, motors
- 5Twin
Live model of the site
Five layers turn a machine into finished work.
The proof ladder.
Five levels of proof.
- 1Concept
Demos and pre-orders
- 2Pilot
Trials, limited paid use
- 3Early commercial
A few paying customers
- 4Commercial
Many paying sites
- 5Scaled
Thousands of units
The proof ladder runs from concept to scaled.
The investment life cycle.
Where Atomgigs helps.
- 1Find
Market map and short list
- 2Diligence
Technology, economics, field
- 3Invest
Terms and committee
- 4Monitor
Dashboard and flags
- 5Exit
Buyers and process
Atomgigs supports the work before the deal and after it.
Glossary
Physical AI, operations and investing terms.
Physical AI terms.
158
Investing terms.
160
Operations terms.
159
Physical AI terms.
Machines and technology.
| Term | Meaning |
|---|---|
| Physical AI | AI that senses, decides and acts in the physical world through machines |
| AMR | Autonomous mobile robot that navigates a changing floor |
| AGV | Automated guided vehicle that follows a fixed route |
| Cobot | Robot arm built to work near people |
| Humanoid | Robot with a human-like body, walking or on wheels |
| Teleoperation | A person controls or assists a robot remotely |
| Digital twin | Live model of a site or machine |
| BVLOS | Beyond visual line of sight, a drone flight rule |
| Terms are used the same way throughout the Atomgigs primers. | |
Operations terms.
Running machines.
| Term | Meaning |
|---|---|
| Utilization | Hours a machine works divided by hours available |
| Uptime | Share of time a machine is ready to work |
| OEE | Overall equipment effectiveness of a plant or line |
| Integrator | Firm that installs and connects machines at a site |
| RaaS | Robots as a service: pay by month, hour or task |
| Pilot | A limited trial to prove a machine at a site |
| Payback | Time for savings to repay the cost |
| eVTOL | Electric vertical take-off and landing aircraft |
| Terms are used the same way throughout the Atomgigs primers. | |
Investing terms.
Deals and finance.
| Term | Meaning |
|---|---|
| Mega-round | Funding round of $100M or more |
| Pre-money value | Company value before new funding |
| Enterprise value | Equity value plus debt, less cash |
| SPAC | Listed shell company that merges with a private company |
| Tuck-in | Small acquisition that adds a capability |
| Roll-up | Combining many small firms into a larger one |
| Backlog | Contracted work not yet delivered or billed |
| Runway | Months of cash left at the current burn rate |
| Terms are used the same way throughout the Atomgigs primers. | |
Quick reference
Key numbers, rules of thumb and organizations.
Key numbers.
162
Industry organizations.
164
Rules of thumb.
163
Key numbers.
Reference figures.
| Measure | Figure | Context |
|---|---|---|
| Industrial robots installed worldwide | 603,307 | 2025 |
| Robots operating in factories | 5.08M | 2025 |
| Professional service robots shipped | ~250K | 2025 |
| Robotics startup funding (Crunchbase) | $27B+ | Jan–Sep 2026 |
| Four hyperscalers’ 2026 capex | $720B+ | Outlook |
| U.S. construction spending | $2.19T | Sep 2026 annual rate |
| U.S. defense appropriations | $839B | FY2026 |
| Open U.S. manufacturing jobs | 584K | Sep 2026 |
Key numbers used in this primer.
Rules of thumb.
Simple tests.
| Rule of thumb | Formula | Use it for |
|---|---|---|
| Break-even hours | Cost per year ÷ loaded wage | Does a robot earn more than it costs |
| Utilization | Hours run ÷ hours available | Robots as a service economics |
| Hardware share | About half of mobile robot cost | Total cost quotes |
| Proof level | Concept to scaled | Underwriting |
| Margin | Gross margin by line | Hardware versus service |
Simple tests that hold across sectors.
Industry organizations.
Standards and statistics.
| Organization | What it does | Why it matters |
|---|---|---|
| IFR | International Federation of Robotics | Robot installation statistics |
| A3 | Association for Advancing Automation | Robotics standards and data |
| ISO and ANSI | Standards bodies | Robot and machine safety |
| FAA | U.S. aviation regulator | Drone and VTOL rules |
| OSHA | U.S. workplace safety agency | Safety rules at sites |
| NIST | U.S. standards institute | Measurement and AI frameworks |
| IEEE | Engineering society | Technical standards |
Where to find standards and statistics.
Have a project that needs hands and machines?
Tell us about the site, the scope and the schedule. We will come back with a pilot proposal.