A secure building that houses computers and keeps them powered, cooled and connected around the clock.
PowerGrid and backup
WaterFor cooling
FiberConnectivity
LandAnd permits
PeopleSkilled staff
→
THE DATA CENTER
Secure buildingStructure, security, fire protection
Electrical systemsTransformers, UPS, generators
Cooling systemsChillers, air handlers, liquid loops
IT equipmentServers, storage, network
ConnectivityFiber, carriers, cloud on-ramps
Operations24/7 monitoring and maintenance
→
ComputeProcessing
StorageData at rest
ConnectivityData in motion
HeatThe byproduct
Nearly every digital service, from email and banking to streaming and AI, runs on servers inside a data center.
Scale ranges from a single server room to campuses drawing over a gigawatt, more power than a mid-size city.
1.2WHAT DATA CENTERS DO
Three services: compute, store and connect.
Every digital interaction combines processing, stored data and network movement, delivered from a data center.
Compute
Running applications and calculations on CPUs, GPUs and custom AI chips. Examples: Websites and apps, banking transactions, AI model training and answers, scientific simulation.
Store
Keeping data safe, available and backed up, from hot flash to deep archive. Examples: Photos, video, documents, medical and financial records, backups and disaster recovery, training data for AI.
Connect
Moving data between users, clouds, carriers and other data centers. Examples: Internet exchange points, cloud on-ramps, content delivery, private networks.
Who uses them
Cloud providers, AI labs, enterprises, governments, carriers, content platforms.
How they are delivered
Owned outright, leased from an operator, or consumed as cloud services.
1.3A SHORT HISTORY
From computer rooms to AI factories in eighty years.
Each era raised the scale, density and power of the facilities that house computing.
Room-sized computers
ENIAC fills a room and draws about 150 kW, an early data center in all but name.
Mainframe era
Corporate computer rooms with raised floors, dedicated cooling and controlled access.
Dot-com and colocation
Client-server and the internet create carrier hotels and the first colocation firms.
Cloud computing
Amazon Web Services launches; computing becomes a service rented by the hour.
Hyperscale
Cloud and social platforms build 100 MW+ campuses with custom, efficient designs.
AI factories
Generative AI drives GPU clusters, liquid cooling and gigawatt-scale campuses.
The constant: every generation of computing has needed more power per square foot than the last.
1.4THE JOURNEY OF A REQUEST
What happens in the half-second after you tap an app.
A request crosses several networks to reach a data center, then the answer travels back, usually in milliseconds.
Device
Phone or laptop sends the request
Access network
Wi-Fi, 5G or home broadband
Internet provider
Routes traffic across its backbone
Exchange point
Networks hand off traffic at a carrier hotel
Data center
Load balancer picks a server
Servers and storage
Compute the answer, read the data
The response returns along the same path.
Distance matters
Light in fiber covers about 200 km per millisecond, so each 100 km adds roughly 1 ms of round-trip delay.
Why location matters
Latency-sensitive services (trading, gaming, video calls) sit close to users; AI training can sit far away.
Many data centers, one answer
A single page can draw on several facilities: content networks, cloud regions and backups.
Carrier hotels such as One Wilshire in Los Angeles are where networks meet; they anchor nearby data center clusters.
1.5WHAT EVERY DATA CENTER NEEDS
Four essentials: power, cooling, connectivity and land.
A site that lacks any one of these cannot host a data center, however good the others are.
The scarcest input today
Power
Utility connection at scale, often 100 MW+. Redundant feeds and on-site backup. Cost and carbon intensity of supply. Years-long interconnection queues.
Removing every watt as heat
Cooling
Chillers, air handlers or liquid loops. Water for evaporative systems. Climate sets free-cooling hours. Density drives the cooling choice.
Fiber to the world
Connectivity
Diverse fiber routes into the site. Multiple carriers for resilience. Proximity to exchanges and clouds. Low latency to users.
The right ground, approved
Land and permits
Zoning that permits data centers. Room for phased expansion. Low natural-hazard risk. Community and regulatory support.
Plus people: electricians, engineers and technicians to build it and keep it running 24 hours a day.
1.6UNITS OF SCALE
From one server to a gigawatt campus.
Data centers are built in repeating blocks. Each level multiplies the one below it.
Typical power at each level
01~1–10 kW
Server
A single computer; an AI server holds 8 GPUs
0210–130 kW
Rack
A cabinet of servers, the basic unit of density
030.2–2 MW
Row / pod
A contained row of racks sharing cooling
042–10 MW
Data hall
A room of rows with its own power and cooling
0520–100 MW
Building
Several halls plus electrical and mechanical rooms
06100 MW – 1 GW+
Campus
Multiple buildings, a substation and room to grow
1.7HOW CAPACITY IS MEASURED
Power is the unit of measure.
A "100 MW data center" usually means 100 MW of IT capacity; the building draws more to run cooling and losses.
Term
Meaning
Critical IT load
Power available to servers, storage and network. The capacity customers lease.
Total facility load
IT load plus cooling, lighting and electrical losses. What the utility supplies.
PUE
Total facility power ÷ IT power. 1.0 is perfect; the industry average is about 1.54.
kW per rack
Power density. Sets the cooling method: air up to ~30–40 kW, liquid beyond.
MW vs MWh
MW is capacity at an instant; MWh is energy used over time. Bills are in kWh.
Utilization
IT load actually drawn ÷ capacity leased. Often well below 100% as tenants ramp.
Worked example: a 100 MW facility
100 MWIT capacity leased to customers
× 1.3PUE of a modern facility
130 MWPeak draw from the grid
~1.1 TWhEnergy per year at full load
~75,000Homes, at ~750 homes per MW
1.8WORKLOADS
What runs inside determines how it is built.
Different workloads need different density, latency, location and resilience.
Workload
Examples
Rack density
Latency need
Facility implication
Enterprise IT
ERP, email, databases, internal apps
5–15 kW
Medium
Colocation or on-premises; high reliability
Public cloud
AWS, Azure, Google Cloud services
10–30 kW
Medium
Hyperscale regions near population hubs
AI training
Building large language and vision models
40–130+ kW
Low
Remote, power-rich sites; liquid cooling
AI inference
Answering prompts, recommendations, copilots
20–80 kW
Medium–high
Closer to users; growing fastest
Storage and backup
Archives, backups, media libraries
5–10 kW
Low
Lower-cost sites; high floor loading
Network and content
Exchanges, CDNs, streaming caches
5–15 kW
Very high
Urban carrier hotels and edge sites
High-frequency trading
Exchange matching and market data
10–30 kW
Extreme
Next to exchange data centers
The shift from cloud to AI workloads is the single biggest change in data center design in two decades.
Part 2
Market and industry
How big the market is, who builds, who buys, and where.
AI and cloud are driving the largest infrastructure build in the history of technology. Supply cannot keep up, and power has become the binding constraint.
Private equity and infrastructure funds own much of the third-party sector; hyperscalers increasingly co-fund builds.
2.8CUSTOMERS AND SERVICES
Who buys capacity, and what they buy.
Pricing is usually quoted per kW of committed power per month; primary-market rents are rising 4–8% a year.
Hyperscale cloud and AI
The majority of new leasing
Enterprises
Finance, healthcare, retail, manufacturing, media
Network and content
Carriers, CDNs, streaming, SaaS
Public sector
Federal, state, defense, research, universities
Service
What the customer gets
Typical buyer
Wholesale / powered shell
Whole hall or building
Hyperscalers, AI
Build-to-suit
Facility built to one specification
Hyperscalers
Retail colocation
Racks, cages, suites
Enterprises, SaaS
Interconnection
Cross-connects, cloud on-ramps
Carriers, finance
Managed services
Remote hands, monitoring, DR
Enterprises
Cloud (IaaS / PaaS)
On-demand compute and storage
All segments
GPU-as-a-service
Rented AI compute
AI companies
Edge hosting
Small sites near users
Telecom, CDN, IoT
Services offered
2.9KEY U.S. MARKETS
Growth goes wherever power can be delivered fastest.
Northern Virginia is still the largest market; Atlanta now leads on construction.
Market
Inventory
Under construction
Position (H1 2026)
Northern Virginia
~4,500 MW
~2,420 MW
Largest market; vacancy ~0.2%; land, permitting and power constraints
Atlanta
Fast-growing
~2,880 MW
Now #1 by construction; incentives, labor and rural sites
Dallas–Fort Worth
Large
Significant
Vacancy ~1.8%; grid interconnection delays
Chicago
Large
Significant
Vacancy ~2.2%; hyperscale, enterprise and finance demand
Phoenix
Large
Significant
Land and power available; hot, dry climate raises cooling load
Silicon Valley
~450–540 MW
Limited
Mature, high-cost, severely power-constrained
Southern California
~200 MW
~100 MW
Passed NY Tri-State in inventory; AI driving new demand
Emerging
–
Growing
Texas (Abilene, Austin–San Antonio), Ohio, Central Washington, Reno, Las Vegas
CBRE inventory counts leased third-party capacity; other trackers include self-built and planned sites.
2.10MARKET CONSTRAINTS
Five constraints decide what gets built.
Capital and demand are plentiful. Power, equipment, people and permission are not.
01
Power
Grid interconnection takes years in major markets. PG&E alone reports a 12+ GW data center pipeline.
02
Equipment
Large transformers take up to 3–5 years; medium-voltage switchgear is sold out through 2028 in many channels.
03
People
U.S. construction needs ~349,000 net new workers in 2026; electricians are the scarcest trade.
04
Permission
Local opposition, moratoria and bans are rising; air permits and zoning set schedules.
05
Capital cost
Hyperscaler capex now outruns cash flow; more builds rely on debt, equity and joint ventures.
30–50% of planned 2026 U.S. capacity could slip or be cancelled because electrical gear cannot be delivered on time.
2.11CALIFORNIA AT A GLANCE
California: strategic, expensive and power-constrained.
Tracked facilities and projects, August 2026. Power figures are reported or announced and use mixed measures.
371Tracked sites and projects
305Operational
4.4 GWReported power
2.8 GWPlanned pipeline
12+ GWPG&E data center pipeline
County
Sites
Pipeline
Reported power
Santa Clara
139
32
~2.0 GW
Los Angeles
59
5
~302 MW
Kern
5
3
~144 MW
Alameda
15
1
~136 MW
Sacramento
25
1
~102 MW
San Francisco
14
0
~96 MW
Orange
23
0
~63 MW
Top counties
Operating conditions
Commercial power ~25.75¢/kWh (Apr 2026), nearly 2x the U.S. average.
Developers have requested ~18.7 GW of service capacity statewide.
97% of sites sit in high water-stress basins; 80% in very high climate-risk areas.
Mix: 85% colocation and 4% hyperscale by count.
Regional grid about 46% renewable.
2.12CALIFORNIA REGIONS AND UTILITIES
Five California clusters and the utilities that serve them.
The utility determines power cost, interconnection timeline and the rules a project must follow.
Silicon Valley / Bay Area
Santa Clara: ~60+ buildings. San Jose: largest new pipeline. Hayward, Fremont, Sunnyvale. Utilities: Silicon Valley Power, PG&E. Operators: Digital Realty, Equinix, Vantage, CoreSite, STACK, EdgeCore, Prime. Hub: Market Post Tower, San Jose.
Los Angeles / SoCal
Downtown LA: One Wilshire hub. Vernon: city-owned utility. El Segundo, Torrance, Burbank. Orange County: Irvine. Utilities: LADWP, SCE, Vernon PU. Operators: CoreSite, Digital Realty. Equinix, Prime, DataBank, T5.
Taft: Golden Valley Tech Hub. Lemoore: CyrusOne / Ameresco. Inyokern: RB project. Utilities: PG&E, SCE. Land and power available. Hot summers, high cooling load. Early-stage pipeline.
Imperial / Desert
Calipatria: CalEthos campuses. Imperial: AI data center plan. Utility: Imperial Irrigation District. Geothermal and solar nearby. Coachella: moratorium (Jun 2026). Extreme heat, water scrutiny. Large but speculative.
Local pushback is rising: Monterey Park voters banned data centers citywide in June 2026; Coachella imposed a moratorium.
2.13CALIFORNIA: LARGEST PROJECTS
Where California capacity is being built.
Largest published power figures. Measures differ (IT load, campus power, backup generation), so treat as indicative.
Facility / project
Company
City
Status
Published power
Prologis San Jose Campus
Prologis
San Jose
Planned
396 MW campus
Golden Valley Technology Hub
Beacon Data Centers
Taft
Planned
275 MW campus
CalEthos Campus Sites 1 and 2
CalEthos / TerraVolt
Calipatria
Planned
500 MW each
Google R&D data center
Google
San Jose
Announced
250 MW
STACK SVY01 Campus
STACK Infrastructure
San Jose
Operational
100 MW campus
Ameresco NAS Lemoore
CyrusOne
Lemoore
Planned
100 MW
EdgeCore Silicon Valley
EdgeCore
Santa Clara
Operational
99 MW
Microsoft Alviso-Milpitas
Microsoft
San Jose
Under construction
99 MW backup gen.
STACK SVY03A
STACK Infrastructure
Hayward
Planned
76.6 MW
Vantage Santa Clara CA2
Vantage Data Centers
Santa Clara
Operational
75 MW IT
Digital Realty SJC36
Digital Realty
Santa Clara
Planned
66 MW IT
Vantage CA3
Vantage Data Centers
Santa Clara
Operational
64 MW IT
Vernon Data Center
T5
Vernon
Operational
52 MW
Goodman LAX01
Goodman (with DataBank)
Vernon
Delivering 2026–27
32 MW IT / 49.5 MW utility
2.14CALIFORNIA: KEY COMPANIES
The companies that control California capacity.
Operators, developers and hyperscalers, with their California footprint and market position.
Company
Model
California footprint
Position
Digital Realty
Wholesale + retail REIT
~20–24 Silicon Valley sites; LA, El Segundo, Burbank; Vernon site
Largest CA footprint; SJC36 (66 MW) planned
Equinix
Retail / interconnection REIT
Silicon Valley and Los Angeles campuses
Leading interconnection hub; xScale for hyperscale
Vantage Data Centers
Hyperscale developer
Santa Clara CA2 (75 MW), CA3 (64 MW)
Largest hyperscale campuses in Santa Clara
CoreSite (American Tower)
Retail + interconnection
One Wilshire (LA); Santa Clara campus
LA’s main network hub; 72 MW Bowers Ave planned
STACK Infrastructure
Hyperscale wholesale
San Jose SVY01 (100 MW); Hayward SVY03A (77 MW)
Fast-growing Bay Area developer
Prologis
Industrial REIT / developer
San Jose campus (396 MW planned)
Largest planned Bay Area campus
EdgeCore
Hyperscale wholesale
Santa Clara (99 MW)
Large single-site Santa Clara capacity
Prime Data Centers
Wholesale / colocation
Silicon Valley (7 sites); Vernon; Sacramento
Mid-size, AI-ready builds across CA
NTT / Csquare
Colocation
Santa Clara; Sacramento (NTT)
Enterprise and disaster-recovery capacity
CyrusOne
Hyperscale
NAS Lemoore (100 MW, planned)
Central Valley expansion
T5, DataBank, Goodman
Wholesale / colocation
Vernon (T5 ~52 MW; LAX01 32 MW)
Vernon is LA’s growth corridor
Google, Microsoft, Meta, Apple
Hyperscale self-build + lease
Google 250 MW San Jose; Microsoft Alviso-Milpitas
Largest tenants and self-builders
Utilities matter as much as operators: PG&E, Silicon Valley Power, SMUD, LADWP, SCE, Vernon PU and IID.
2.15CALIFORNIA: POLICY AND CONSTRAINTS
California now makes data centers pay their own way.
SB 886 and AB 2383, the California Technology Innovation and Ratepayer Protection Act, signed September 21, 2026.
What the new law does (effective January 1, 2027)
Data centers pay for transmission upgrades their interconnection requires.
Partial refunds only as utility revenue from the site covers its costs (capped at 75%).
Early-termination fee if a site leaves within 10 years or fails to ramp load.
New generation-service tariff: data centers fund incremental generation costs for at least 10 years, with upfront collateral.
Credit for installing zero-emission resources behind the meter.
Applies to sites above a demand threshold set by the CPUC, at no more than 25 MW; tariffs due by January 1, 2028.
Also applies to community choice aggregators and electric service providers.
Power
Santa Clara sites idle awaiting a ~$500M grid upgrade; PG&E plans ~$73B grid spend through 2030.
Cost
Highest electricity prices of any major U.S. data center market.
Permitting
CEQA review; state energy siting review for large on-site generation (>50 MW).
Water and heat
High water stress statewide; hot inland and desert climates.
Community
Monterey Park ban; Coachella moratorium; active opposition in Kern.
Higher grid costs raise the value of anything that reduces a site’s peak demand or required interconnection capacity.
Part 3
Facility types and site selection
From hyperscale campuses to edge sites, and how a location is chosen.
Facilities differ by who owns them, who uses them and how much power they draw. Site selection now starts with one question: where can power be delivered, and when?
Seven facility types, defined by owner, user and power.
The fastest growth is in hyperscale and AI campuses; enterprise sites are consolidating.
Type
Owner / user
Typical size
Key characteristics
Hyperscale (self-built)
AWS, Microsoft, Google, Meta, Oracle
50 MW – 1+ GW
Custom designs, PUE ~1.1–1.2, sited near low-cost power and land
Wholesale colocation
QTS, Vantage, Digital Realty, STACK lease to one tenant
10 – 300+ MW
10–15 year leases, often build-to-suit for a hyperscaler
Retail / interconnection
Equinix, CoreSite, Digital Realty lease racks and cages
1 – 30 MW
Dense network ecosystems; urban carrier hotels such as One Wilshire
Enterprise (on-premises)
Banks, hospitals, government, universities
0.1 – 20 MW
Often older and less efficient; modernizing or consolidating
AI / HPC "AI factories"
Hyperscalers and neoclouds: CoreWeave, Crusoe, Lambda
50 MW – multi-GW
Rack density 40–130+ kW; requires liquid cooling
Edge
Telecom, CDN, tower and retail sites
< 1 – 5 MW
Small and distributed, close to users for low latency
Modular / prefabricated
Various
Container – 10 MW blocks
Factory-built for speed; expansions and remote sites
Colocation is 85% of tracked California sites by count; hyperscale is only 4% by count but a growing share of power.
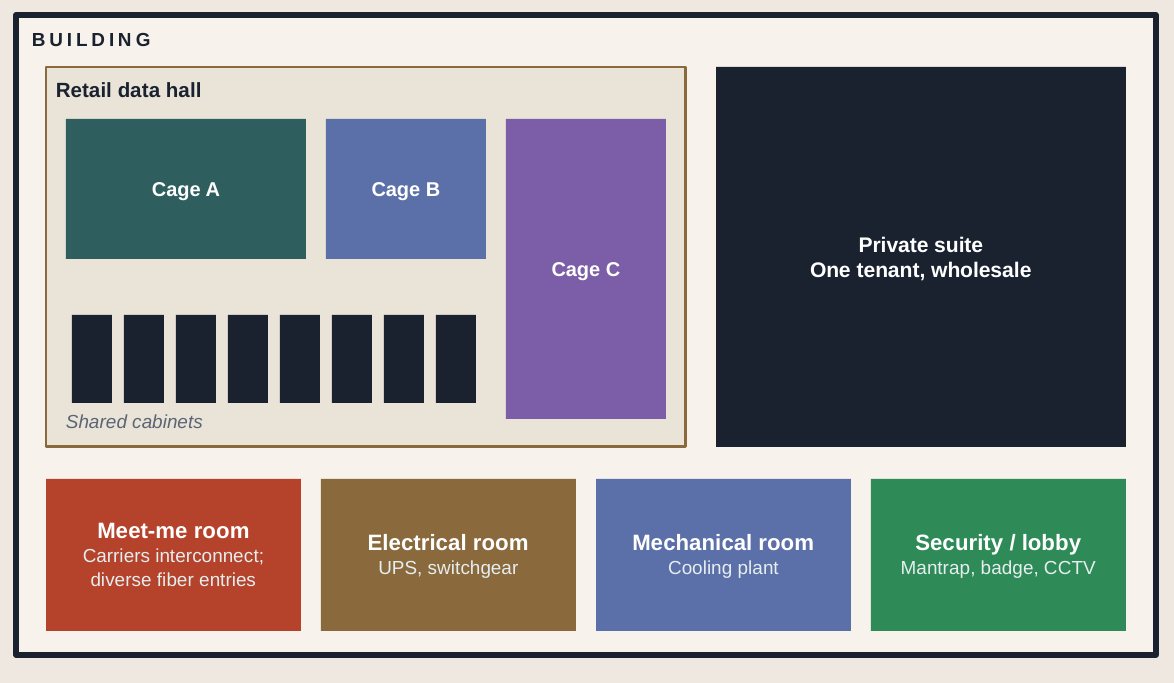
3.2INSIDE A MULTI-TENANT FACILITY
How a colocation building is organized.
One building, many customers: shared power, cooling and security, with private space sold by the cabinet, cage or suite.
Floor plan of a colocation building: a retail data hall with Cages A, B and C and shared cabinets, a private wholesale suite, and the meet-me room, electrical room, mechanical room and security lobby.
Unit sold
What it is
Cabinet
One rack, typically 5–15 kW, in a shared, secured row
Cage
A fenced, locked area holding a group of racks
Suite
A private room with its own access control
Hall / building
Wholesale: an entire hall or building for one tenant
Cross-connect
A cable linking two customers, carriers or clouds
The meet-me room is where carriers and customers connect. Dense interconnection is what makes retail sites valuable.
3.3AI FACTORIES
An AI factory is a different kind of building.
AI clusters concentrate far more power and heat in each rack, which changes almost every design choice.
~120 kWPer AI rack (GB200 NVL72)
~1,000 WPer leading GPU
40–80 kWAI hall design range
1 GW+Largest planned campuses
Design element
Traditional cloud data center
AI factory
Rack density
10–20 kW per rack
40–130+ kW per rack
Cooling
Air cooling, containment
Direct-to-chip liquid cooling, plus air for the rest
Building power
20–60 MW per building
100 MW to 1 GW+ per campus
Network
Ethernet, moderate east-west traffic
Very high-bandwidth fabrics linking thousands of GPUs
Structure
Standard floor loading
Heavier racks and liquid systems; reinforced slabs
Location
Near users and networks
Training can sit wherever power is available
Power profile
Steady load
Large, fast swings as training jobs start and stop
3.4SITE SELECTION CRITERIA
Ten factors decide whether a site works.
Power and fiber come first; the rest determine cost, speed and long-term risk.
Factor
Why it matters
What good looks like
Power availability
Without power, nothing else matters
Capacity confirmed by the utility, with a firm date
Power cost and mix
Electricity is the largest operating cost
Competitive tariffs; clean supply options
Fiber connectivity
Latency and resilience
Two or more diverse routes; multiple carriers
Land and zoning
Room to build and permission to do it
Data center use allowed by right; room to expand
Water
Evaporative cooling and community acceptance
Reliable supply, or a dry-cooling design
Climate
Sets cooling energy and design
Many free-cooling hours; moderate peaks
Natural hazards
Floods, quakes, wildfire, storms
Low risk, or engineered mitigation
Incentives and taxes
Equipment and property taxes are large
Sales-tax exemptions; abatements
Labor
Thousands to build, hundreds to run
Deep trades and technician pool
Community and permits
Opposition can stop projects
Supportive officials; clear approval path
3.5THE SITE SELECTION PROCESS
From a long list of markets to one secured site.
A disciplined funnel narrows options quickly and spends diligence money only on the finalists.
Market screen
Regions with power, demand and policy fit
Long list
~50 candidate sites
Short list
~10 sites; utility conversations
Due diligence
~3 sites; studies and negotiations
Secure
1 site; land, power and approvals locked
Due diligence checklist
Utility capacity study and service agreement
Title, survey, geotechnical and environmental reports
Flood, seismic and wildfire assessment
Fiber route survey and carrier quotes
Water supply and wastewater capacity
Zoning, permits and air-permit pathway
Tax incentives and community engagement plan
Cost estimate and delivery schedule
Developers increasingly buy "powered land": sites where the utility has already committed capacity.
3.6SPEED TO POWER
Speed to power now decides where capacity is built.
Grid connections can take years, so developers combine several paths to energize sites sooner.
Power path
How it works
Typical timing
Trade-offs
Grid interconnection
Utility builds lines and substation capacity
1–4+ years
Lowest long-run cost; queue risk
On-site substation
Developer funds a dedicated substation
2–3 years
Faster control; capital intensive
Bridge power
Temporary gas turbines or engines until grid arrives
Months
Higher cost and emissions; air permits
Behind-the-meter generation
Permanent on-site gas, fuel cells or solar plus storage
1–2 years
Independence; fuel and permitting
Co-location with plants
Build next to an existing power station
Varies
Fast access; regulatory scrutiny
Battery storage
Shaves peaks and supports grid flexibility
Months
Helps interconnection; limited duration
Nuclear agreements
Long-term contracts, restarts and future small reactors
Years
Clean, firm power; long lead times
California’s new law credits zero-emission resources installed behind the meter against generation charges.
Part 4
Anatomy and technology
The building, the power, the cooling, the electronics and the controls.
Every watt a server consumes becomes heat that must be removed. Power and cooling are designed together, and both are built with redundancy.
Fiber entrances; meet-me rooms; carrier equipment; cloud on-ramps; internet exchanges; diverse routes; subsea links (LA)
Control and safety
DCIM software; building management (BMS); sensors and metering; early smoke detection; pre-action sprinklers; gas suppression; physical security
Roughly half of a site is white space for IT; the rest is grey space for power, cooling and support.
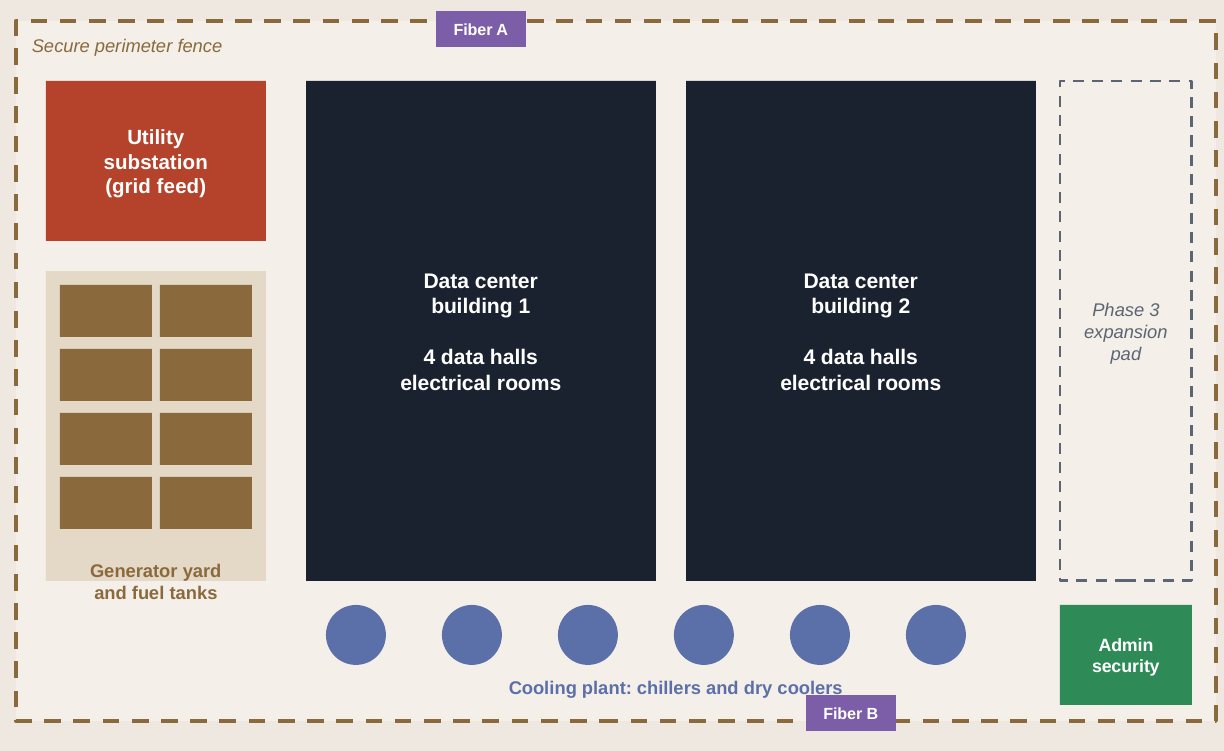
4.2SITE LAYOUT
A typical data center campus, from above.
Illustrative plan of a two-building campus with room for a third phase.
Illustrative plan of a two-building campus inside a secure perimeter fence: utility substation (grid feed), generator yard and fuel tanks, data center buildings 1 and 2 (4 data halls and electrical rooms each), a Phase 3 expansion pad, admin and security, a cooling plant of chillers and dry coolers, and diverse Fiber A and Fiber B entries.
Element
Role
Substation
Steps down transmission voltage for the campus
Generators
Backup power; typically N+1, 24–72 h fuel
Buildings
Data halls plus electrical and mechanical rooms
Cooling plant
Rejects heat from all buildings
Fiber A / B
Diverse entries so one cut cannot isolate the site
Expansion pad
Land and power reserved for later phases
Perimeter
Fence, gates, cameras, guard house
4.3THE BUILDING
An industrial building designed around power.
The structure must carry heavy equipment, resist hazards and leave room for power and cooling distribution.
Site and structure
Land: 10–100+ acres for campuses; multi-story urban sites where land is scarce.
Structure: steel or precast concrete; heavy floor loading for racks, batteries and liquid systems.
Hardening: seismic design (critical in California), flood, wind and fire resistance.
Height: tall clear heights for air handling, busway and cable trays.
Utility yard: substation, generators, fuel tanks and cooling plant.
Inside the building
Data halls (white space): rows of racks with hot / cold aisle containment.
Factory-built power and cooling skids, rapid assembly
Speed, expansions, edge sites
4.4THE WHITE SPACE
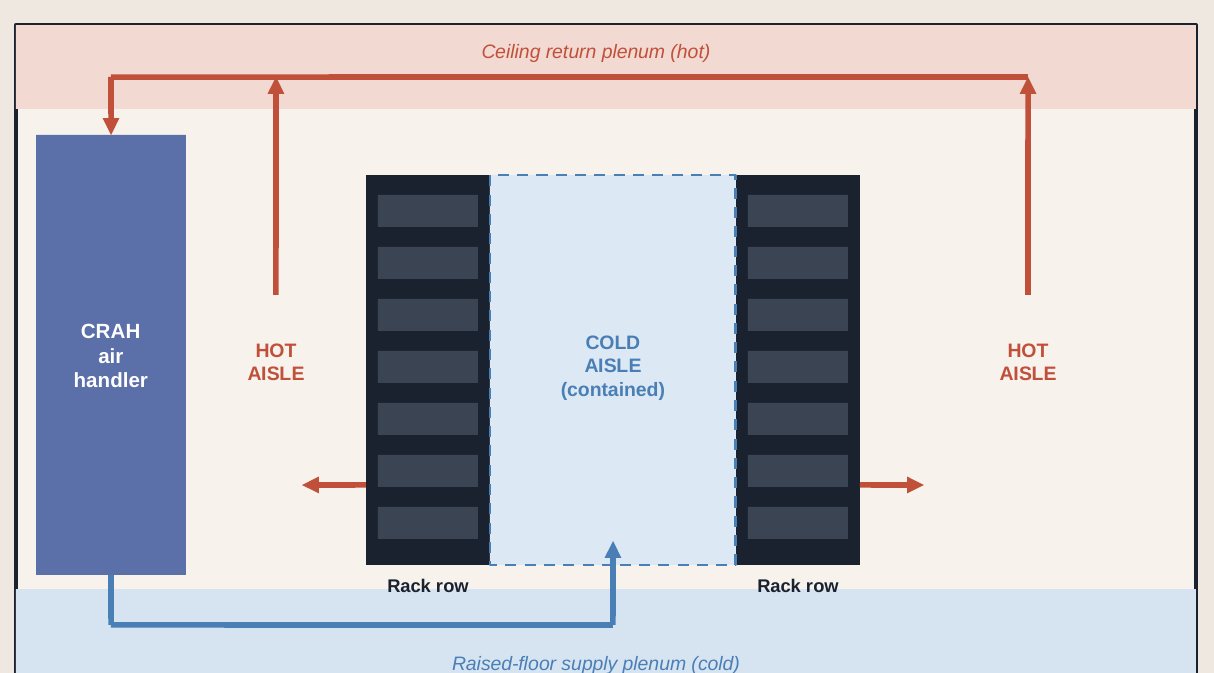
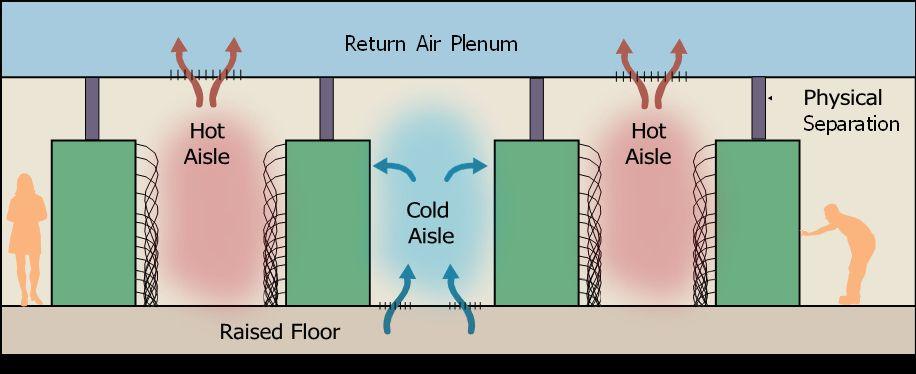
Hot aisles, cold aisles: how air moves through a data hall.
Racks face each other across a cold aisle; servers pull cold air in front and exhaust hot air out the back.
Cross-section of a data hall: CRAH air handler, contained cold aisle between two rack rows, hot aisles either side, a hot ceiling return plenum above and a cold raised-floor supply plenum below.
Key concepts
Containment: physically separating hot and cold air saves fan and chiller energy.
Inlet temperature: ASHRAE recommends about 18–27°C at the server intake.
Blanking panels seal empty rack slots so hot air cannot recirculate.
Many new halls skip the raised floor: slab floors with overhead air, busway and cable trays.
Above ~30–40 kW per rack, air alone cannot remove the heat; liquid takes over.
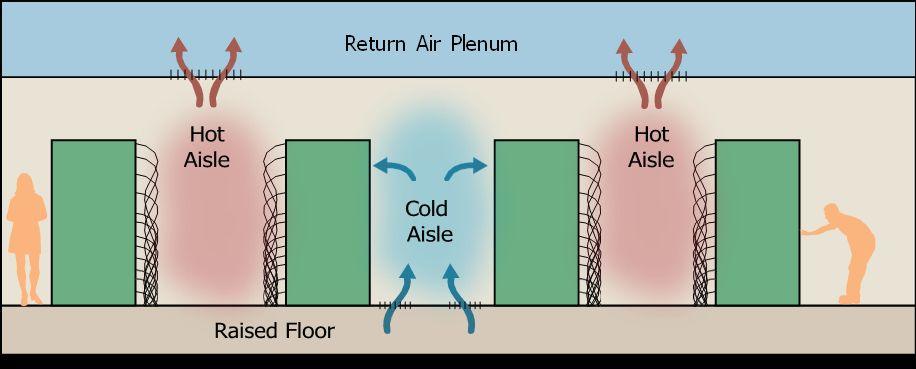
4.5REFERENCE DIAGRAM: AIRFLOW
Airflow in a data hall, without and with containment.
Cold air rises through the floor into the cold aisle, passes through the servers and leaves as hot exhaust.
Open hot aisle / cold aisle: hot and cold air can mix over and around the racks, so cooling units must work harder.Diagram: U.S. Department of Energy, FEMP (public domain)
Contained aisles: physical barriers separate hot from cold air, so supply air reaches the servers at the right temperature.Diagram: U.S. Department of Energy, FEMP (public domain)
Containment is one of the cheapest efficiency upgrades: it lets operators raise supply temperatures and slow the fans.
4.6ELECTRICAL SYSTEMS
The power chain: from grid to chip, without interruption.
Electrical systems are the largest cost block, typically 45–54% of construction cost.
Utility and substation
Grid feed at transmission or distribution voltage; on-site substation for large sites; dual feeds preferred.
Switchgear and transformers
Medium-voltage switchgear and transformers step power down to building voltage; long-lead items.
UPS and batteries
Uninterruptible power bridges any disturbance instantly; lithium-ion is replacing lead-acid.
Distribution
Power distribution units, panels and overhead busway carry power to each row and rack.
Rack and IT
Rack PDUs feed dual server power supplies; AI racks draw 40–130+ kW.
Key electrical terms
Medium voltage (MV): typically 4–35 kV distribution inside large campuses.
Low voltage (LV): 480 V (U.S.) feeding UPS and IT distribution.
Busway: overhead power rails that racks plug into, replacing long cable runs.
Dual-corded IT: each server draws from two independent paths (A and B).
Design priorities
No single point of failure on the critical path.
Concurrent maintainability: service any part without shutting down IT.
Selective coordination, so a fault trips only the nearest breaker.
Efficiency: fewer conversion steps and higher distribution voltages.
4.7POWER PATH REDUNDANCY
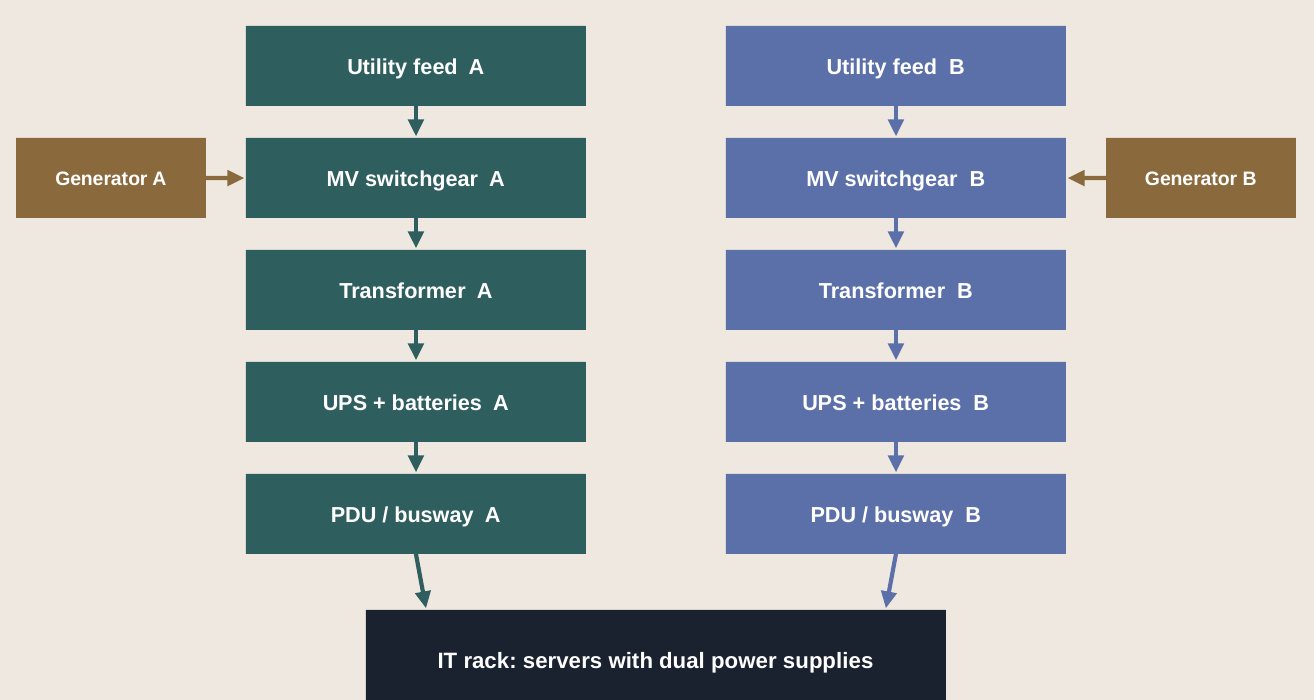
A and B: two independent paths to every server.
A simplified "2N" one-line diagram. Either path alone can carry the full load if the other fails.
Simplified 2N one-line diagram: Path A and Path B each run from utility feed through MV switchgear, transformer, UPS + batteries and PDU / busway, with Generator A and Generator B feeding the switchgear, to an IT rack with dual power supplies.
How to read it
Each path has its own utility feed, switchgear, transformer, UPS and distribution.
If utility power fails, UPS batteries carry the load until generators start.
If an entire path fails or is under maintenance, the other carries 100% of the load.
Lower-cost designs share some components (N+1) instead of fully duplicating them.
4.8BACKUP POWER
When the grid fails: the first 30 seconds.
Batteries carry the load instantly, generators take over within seconds, and IT never notices.
Utility power is lost
UPS batteries carry the load instantly
Generators start and reach speed
Transfer switches move load to generators
Generators run on stored fuel
Load moves back to the utility
UPS and batteries
Double-conversion UPS conditions power continuously.
Batteries sized for roughly 5–10 minutes of ride-through.
Lithium-ion: smaller, longer life; VRLA lead-acid still common.
UPS failures are a leading cause of power-related outages.
Generators and fuel
Diesel generators, often 2–3 MW each, arranged N+1 or better.
24–72+ hours of fuel on site, with refueling contracts.
Tested monthly, often under load; require air permits.
Server inlet air: ASHRAE recommends about 18–27°C.
Warmer water loops allow more hours of free cooling.
Cooling load tracks IT load and outdoor temperature; it peaks on hot afternoons.
Chillers are the largest cooling energy user; night and winter hours are cheapest to cool.
Trade-offs operators manage
Energy vs. water: Evaporative cooling saves power but uses water.
Air vs. liquid: Liquid handles AI density; adds $2.7–3.7M per MW.
Peak vs. average: The plant is sized for the hottest hour of the year.
Retrofit vs. new: Retrofits are disruptive; new builds design in liquid.
4.11THE CHILLED WATER PLANT
Two water loops carry heat out of the building.
The chilled water loop collects heat from the halls; the condenser loop carries it to the cooling towers.
Data hallAir handlers (CRAH) pass warm room air over cold-water coils
→
Chiller
Chilled water supply (cold)Chiller to data hall
Return (warm)Data hall back to chiller
CompressorMoves heat from the chilled loop to the condenser loop
→
Cooling towerEvaporation or dry coolers release heat to the air. Condenser water (hot) goes up from the chiller; condenser water (cooled) returns. Heat to atmosphere.
Free cooling (economizer)
When outside air is cool enough, the chiller is bypassed and towers or dry coolers cool the water directly, saving most of the energy.
Thermal storage
Tanks of chilled water, or ice, are charged when power is cheap or demand is low and drawn down at peak.
Redundancy
Chillers, pumps and towers are installed N+1 or better, so one can be serviced while the others carry the load.
4.12REFERENCE DIAGRAM: THE CHILLER
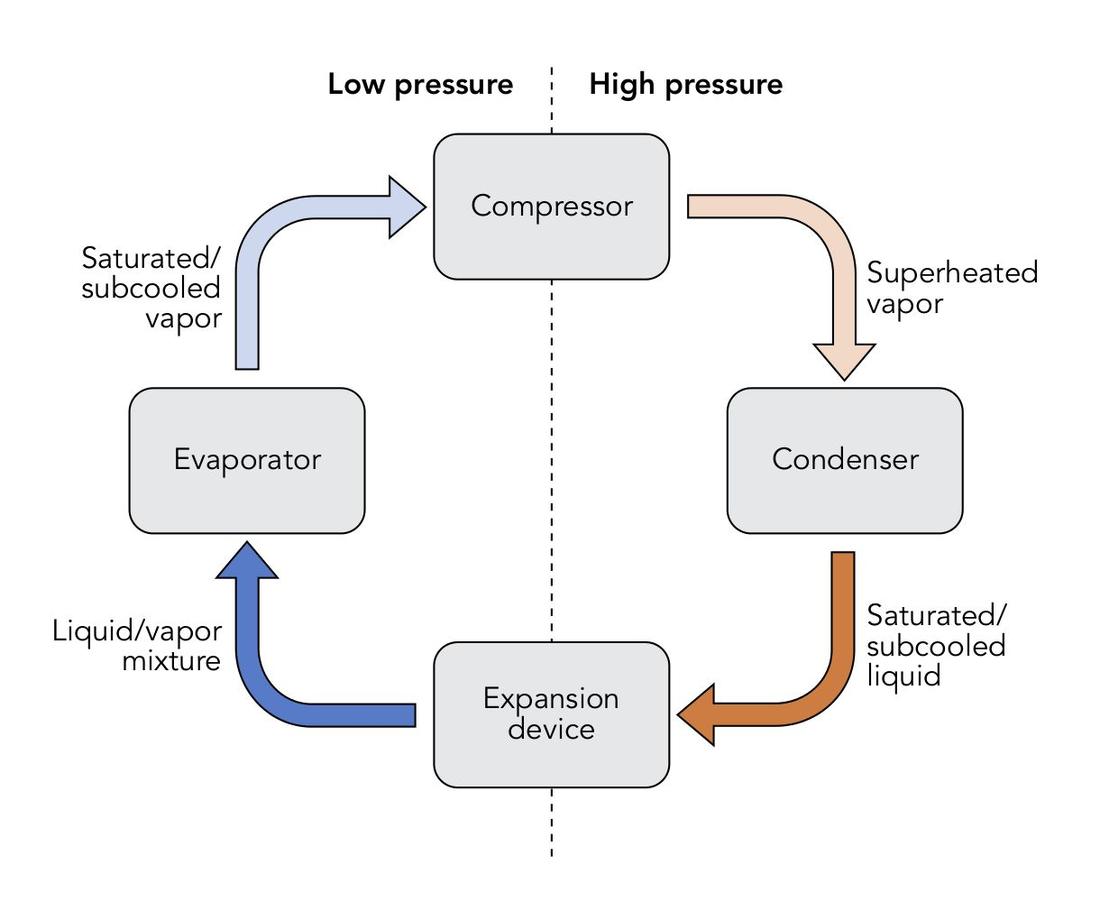
How a chiller moves heat out of the water loop.
A refrigeration cycle takes heat from the chilled water and hands it to the condenser water and cooling towers.
Vapor compression cycle: compressor, condenser, expansion device and evaporator, with low-pressure and high-pressure sides.Diagram: WGisol, Vapor Compression Cycle, Wikimedia Commons, CC BY-SA 4.0
Evaporator
Cold refrigerant absorbs heat from the building's chilled water, which leaves at roughly 7–18 °C.
Compressor
Raises the refrigerant's pressure and temperature; this is where most of the chiller's electricity goes.
Condenser
Hot refrigerant gives up its heat to the condenser water, which carries it to the cooling towers.
Expansion device
Drops the pressure so the refrigerant turns cold again and the cycle repeats.
Free cooling bypasses the compressor when outside air is cold enough.
4.13COOLING TECHNOLOGIES COMPARED
Cooling approaches, from air to immersion.
Most sites combine several: air for general IT, liquid for high-density racks, economizers when weather allows.
Approach
How it works
Rack density
Where used
Chillers + air handlers
Chillers make cold water; air handlers cool the room
Up to ~20 kW
Most existing facilities
Evaporative / adiabatic
Evaporating water cools air or water
Up to ~20 kW
Dry climates; low energy, high water
Free cooling / economizers
Outside air or water when weather allows
Up to ~20 kW
Cooler climates and night hours
Rear-door heat exchangers
Water-cooled coil on the back of each rack
20–50 kW
Retrofits for higher density
Direct-to-chip liquid
Coolant through cold plates on processors
50–130+ kW
New AI and HPC deployments
Immersion
Servers submerged in dielectric fluid
100 kW+
Niche, very high density
Thermal energy storage
Chilled water or ice made off-peak, used at peak
Supports any
Peak shifting, chiller support
Densities indicative.
About one in five data centers used liquid cooling by early 2026; adoption is accelerating with each GPU generation.
4.14LIQUID COOLING
Liquid cooling: bringing water to the chip.
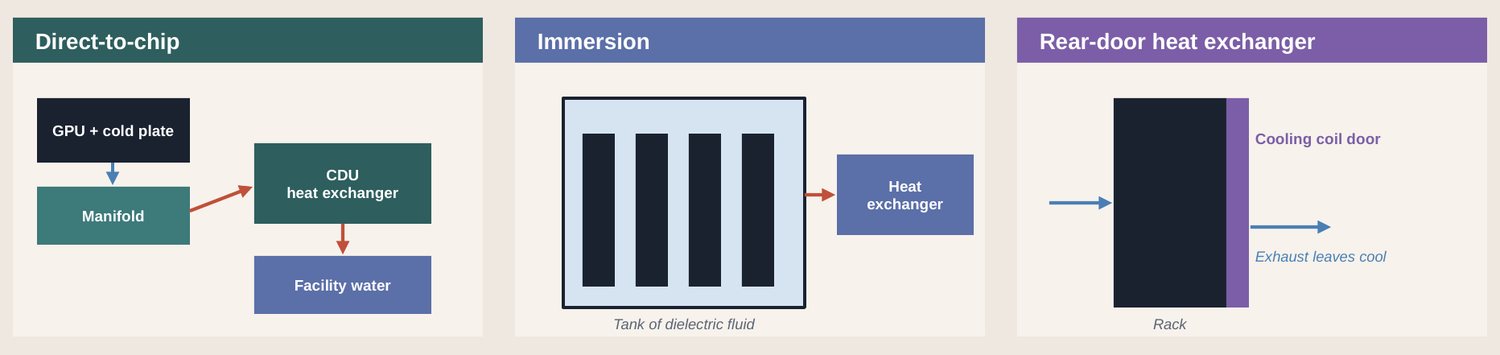
Water carries heat thousands of times more effectively than air, which is why AI racks depend on it.
50–130+ kW per rack
Direct-to-chip
Cold plates sit on GPUs and CPUs; a coolant distribution unit (CDU) isolates the IT loop from facility water. The dominant approach for AI.
100 kW+ per rack
Immersion
Whole servers are submerged in non-conductive fluid. Highest density and efficiency; changes how hardware is serviced.
20–50 kW per rack
Rear-door heat exchanger
A water-cooled coil on the rack door removes heat as air leaves. A practical retrofit for existing air-cooled halls.
Direct-to-chip: GPU and cold plate, manifold, CDU heat exchanger, facility water. Immersion: tank of dielectric fluid with a heat exchanger. Rear-door: rack with a cooling coil door, exhaust leaves cool.
4.15REFERENCE DIAGRAM: LIQUID COOLING LOOPS
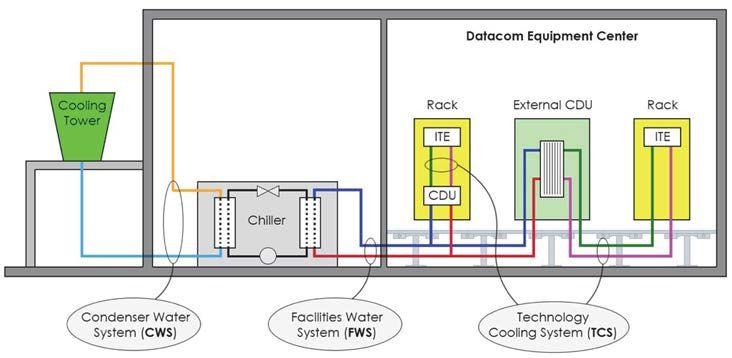
Three water loops connect the cooling tower to the chip.
A coolant distribution unit (CDU) separates the clean coolant in the racks from the building's facility water.
Cooling tower, chiller, CDU and chip cold plates joined by the condenser, facility and technology cooling loops.Diagram: U.S. Department of Energy, FEMP (2024), public domain
Condenser water (CWS)
Cooling tower to chiller: rejects the heat to the atmosphere.
Facility water (FWS)
Chiller to the CDUs: the building's main cooling loop.
Technology cooling (TCS)
CDU to the cold plates on each chip: a small, sealed loop of treated coolant.
Warm-water designs run the facility loop hot enough to skip the chiller for much of the year, using only dry coolers.
4.16REFERENCE DIAGRAM: AIR VERSUS LIQUID
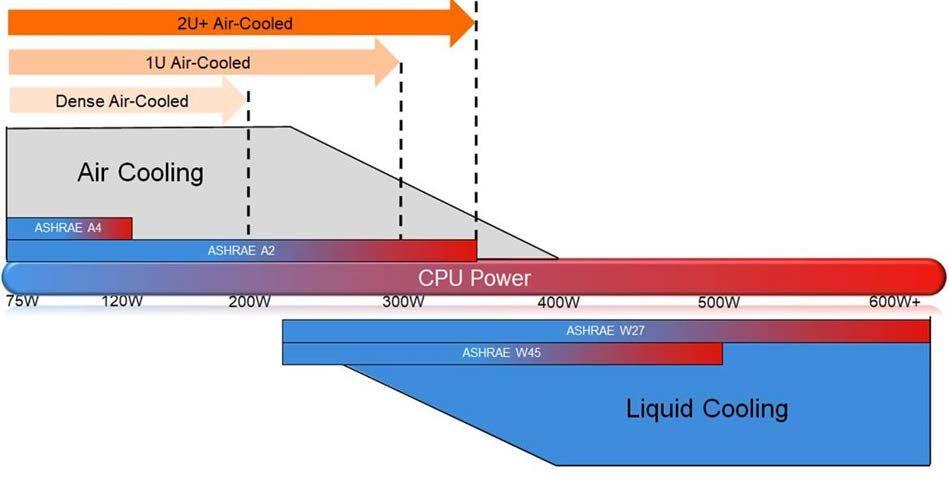
Chip power decides when air cooling runs out.
As processors pass a few hundred watts each, air can no longer carry the heat away and liquid takes over.
Cooling method by power per processor, 75 W to 600 W and beyond. ASHRAE classes A2–A4 (air) and W27–W45 (water) shown.Diagram: U.S. Department of Energy, FEMP (2024), public domain
Reading the chart
The horizontal bar is power per processor, from 75 W to 600 W and beyond.
Air cooling (top) works for chips up to roughly 300–400 W, depending on server size.
Liquid cooling (bottom) covers the whole range and is the only option at the top end.
Today's AI GPUs draw around 1,000 W or more each, far past the air-cooled limit.
4.17WATER AND HEAT
Water use and heat reuse are now design decisions.
Cooling choices trade energy against water; waste heat is increasingly treated as a resource.
Cooling design
Water use
Energy use
Notes
Evaporative cooling towers
High
Low
Most efficient in dry climates; draws on local water supply
Air-cooled chillers / dry coolers
Very low
Higher
Common in water-stressed regions such as California
Adiabatic (hybrid) coolers
Low–medium
Medium
Use water only on the hottest days
Closed-loop liquid cooling
Very low
Low
Sealed loops; heat rejected through dry coolers
Measuring water
WUE: liters of water per kWh of IT energy.
Ranges from near zero (dry) to 2+ L/kWh (evaporative).
Water reporting is growing under EU rules and community pressure.
Reusing heat
Nordic data centers feed waste heat into district heating networks.
Liquid cooling produces warmer water that is easier to reuse.
Uses: buildings, greenhouses, pools and industrial processes.
4.18IT EQUIPMENT
The electronics drive every other design decision.
The IT inside often costs more than the building, and is replaced every 4–6 years.
~10 kWTypical enterprise rack
10–30 kWGrowing mainstream
40–80 kWAI hall design range
~120 kWNVIDIA GB200 NVL72 rack
~1,000 WPer leading GPU
Compute
Storage
Network
Rack infrastructure
Lifecycle
CPU servers
Flash (NVMe) arrays
Top-of-rack switches
Racks and cabinets
Refresh every 4–6 years
GPU servers (NVIDIA, AMD)
Hard-disk capacity tiers
Spine / core switching
Rack PDUs
Density rises each cycle
Custom AI chips (TPU, Trainium)
Object storage
InfiniBand / Ethernet fabrics
Liquid manifolds
Owned by tenant (colo)
Training vs. inference
Backup and archive
Optics and fiber
Cable management
Secure disposal at end of life
Each GPU generation raises power and heat per rack, so facilities must be designed for the next cycle, not the current one.
4.19NETWORK ARCHITECTURE
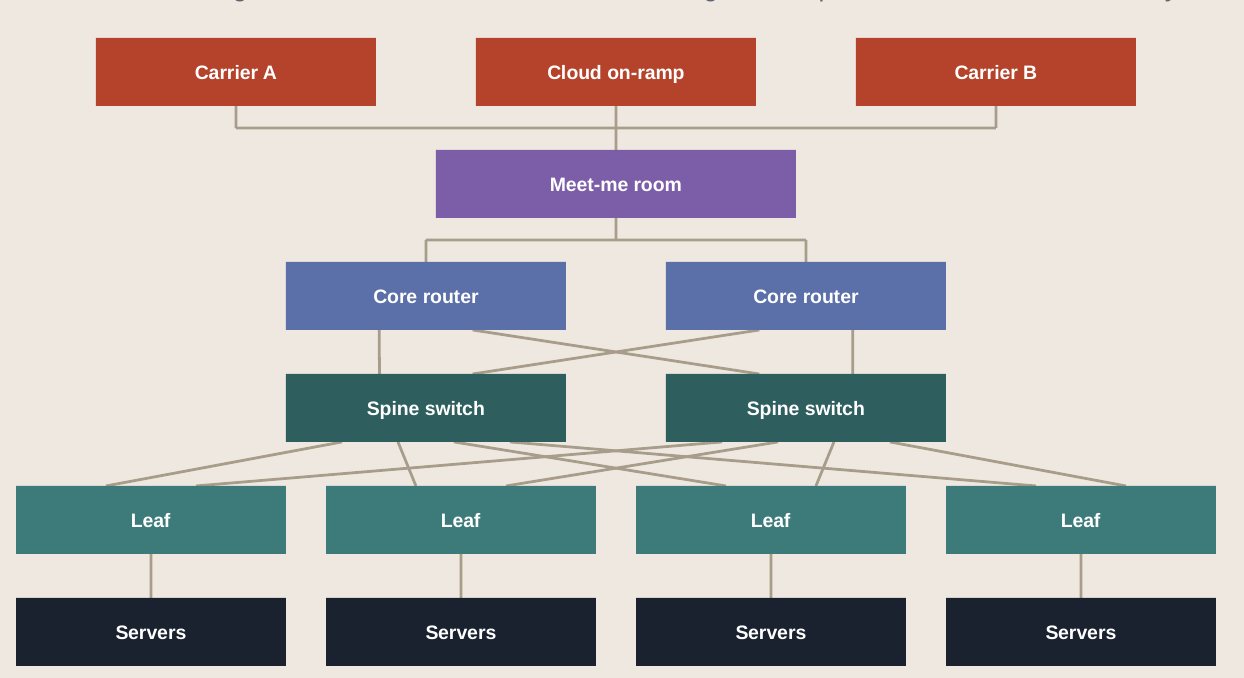
Spine and leaf: how data moves inside the building.
Traffic enters through the meet-me room and fans out through core, spine and leaf switches to every server.
Carrier A, cloud on-ramp and Carrier B feed the meet-me room, then two core routers, two spine switches, four leaf switches and their servers.
Key points
Every leaf connects to every spine, so traffic between any two racks crosses the same number of hops.
Diverse carriers and fiber routes avoid a single point of failure.
Cloud on-ramps give private, direct links to AWS, Azure and Google.
AI clusters add a separate, very high-bandwidth fabric just for GPU-to-GPU traffic.
4.20ANATOMY OF AN AI CLUSTER
From one GPU to a 100,000-GPU cluster.
AI systems are built in tightly linked blocks; the rack has become the unit of design.
1~1 kW
GPU
One accelerator
2~10 kW
Server
8 GPUs plus CPUs
3~120 kW
Rack
e.g. 72 GPUs (NVL72), liquid-cooled
4~1–2 MW
Pod
Several racks on one fabric
5100 MW+
Cluster
10,000–100,000+ GPUs
Scale-up network
Inside a rack, GPUs are linked by very fast interconnects (e.g. NVLink) so 72 GPUs act like one large processor.
Scale-out network
Racks are joined by InfiniBand or high-speed Ethernet fabrics, often thousands of optical links per pod.
Power behavior
Training jobs make power draw swing sharply and in sync, which stresses UPS systems and the grid.
4.21MONITORING AND CONTROL
Thousands of sensors, one picture of the facility.
Layered control systems turn raw measurements into alarms, automation and decisions.
Capacity, assets, power and space planning, analytics
Operations
Control room (NOC), ticketing, work orders, change management
Control systems
BMS (cooling), EPMS (power), fire panels, security systems
Field devices
Temperature and humidity sensors, power meters, PLCs, leak detectors
What it enables
Real-time PUE, temperature and power tracking.
Alarms before small issues become outages.
Capacity planning: where the next rack can go.
Automated cooling that follows the IT load.
The data foundation for a digital twin.
4.22PHYSICAL SECURITY AND FIRE PROTECTION
Layers of protection, from the fence to the cabinet.
Each layer adds a check; reaching a server means passing every one of them.
Layer
Controls
Perimeter
Fence, gates, vehicle barriers, cameras
Building
Hardened walls, guards, limited entrances
Lobby / mantrap
Badge plus biometric; one person at a time
Data hall
Zoned badge access, cameras, logs
Cage
Locked enclosure per customer
Cabinet
Locks and door sensors
Fire protection
Very early smoke detection (VESDA) samples the air continuously.
Pre-action sprinklers: pipes stay dry until two signals confirm a fire.
Clean-agent gas in some rooms (NFPA 2001); NFPA 75 and 76 apply.
Part 5
Design, build and digital twins
Standards, permits, construction, commissioning and the virtual facility.
A data center is designed to a reliability standard, permitted, built and tested. Digital twins now let owners build, test and run the facility virtually first.
Real projects on data center sites, from construction drilling to humanoids in operations.
DEWALT AND AUGUST ROBOTICS
Autonomous drilling fleet
A fleet-capable downward-drilling robot built for data center slabs, piloted with a leading hyperscaler (results in Part 6 · 6.10 Robotics: why now); contractors such as DPR are validating it in 2026.
BUILT ROBOTICS
Autonomous pile driving
Autonomous pile drivers have worked on Meta data center sites, installing foundations faster and with fewer crew hours.
HYPERSCALE DATA
Humanoids in operations
Announced plans to deploy 30 humanoid robots at its Michigan data center campus, targeted for the third quarter of 2026.
NVIDIA ISAAC SIM AND GR00T
Training in simulation
Robots learn perception and manipulation tasks inside digital twins before they are deployed on a real site.
6.14THE HYBRID WORKFORCE MODEL
From human crews to hybrid human-robot teams.
Robots join the work task by task; people move toward supervision, exceptions and complex work.
STAGE 1
Skilled human crews
Electricians, pipefitters and commissioning technicians do the work, supported by digital tools. People do almost all physical work. BIM and digital twins guide the build. Robots used for scanning and inspection.
STAGE 2
Hybrid teams
Proven task robots work alongside crews, run by trained robot operators. Robots drill, mark layout and move materials. People supervise, set up and handle exceptions. New roles: robot operator and technician.
STAGE 3
Orchestrated fleets
Mixed human and robot workforces scheduled together across build and operations. Fleets coordinated through the digital twin. Humanoids take on varied tasks as they mature. People focus on judgment and complex work.
The goal is not fewer skilled people, but more capacity built and run with the skilled people available.
6.15ROBOTICS ADOPTION ROADMAP
An indicative roadmap for robotics adoption.
Adoption moves from narrow, proven construction tasks toward broader autonomy in operations.
Humanoids for varied tasks; fleets orchestrated through digital twins.
Adoption consideration
What to plan for
Safety and standards
Risk assessments, exclusion zones and certified equipment on live sites
Integration
Robots fed from BIM and the digital twin; results written back to the model
Workforce
Training, new operator roles, labor agreements and change management
Economics
Utilization across projects; cost per task versus manual methods
Support
Maintenance, spares, software updates and cybersecurity
Part 7
Financials
How data centers are priced, what they cost, and how they make money.
Revenue is rent on power: dollars per kilowatt per month, on long leases. Returns come from the spread between yield on cost and the value of a stabilized asset.
Self-fund most builds | Now raising debt and equity | Alphabet $84.75B equity (2026) | Lease from developers too
Structured finance
Construction loans | ABS / CMBS on stabilized sites | Project finance | Preleases secure lending
Neoclouds
GPU-backed term loans | ~11–15% cost of debt | Customer concentration risk | Fastest growth, most risk
Financing has shifted: hyperscaler debt rose from 9% of capex in FY24 to about 32% by mid-2026.
7.10HOW VALUE IS CREATED
Build at cost, lease up, and value rises by about 80%.
Using the illustrative 20 MW facility: value at a 6% cap rate versus the cost to build it.
Build cost, value created and stabilized value, $M
Build cost$240M
Value created+$201M
Stabilized value~$441M
The value equation
NOI of $26.5M ÷ build cost of $240M = 11% yield on cost.
Investors accept about a 6% yield on stabilized assets: $26.5M ÷ 6% ≈ $441M.
The gap between 11% and 6% is the value created by developing.
Higher rents, lower costs or faster delivery widen the gap; higher interest rates narrow it.
Part 8
Frontier and outlook
How AI is reshaping data centers, and what comes next.
Each GPU generation raises the power, heat and scale of the facilities around it. Power, speed of delivery and efficiency will decide who leads the next decade.
Six shifts that separate AI factories from the cloud data centers of the last decade.
01
Density
Racks have jumped from ~10 kW to ~120 kW, and each GPU generation pushes higher.
02
Liquid by default
Direct-to-chip cooling is becoming standard for new AI halls.
03
Gigawatt campuses
Single sites are planned at 1 GW and above, with multi-billion-dollar budgets.
04
Power behavior
Synchronized training loads swing sharply, stressing UPS systems and the grid.
05
New geography
Training follows available power; inference stays closer to users.
06
Faster refresh
IT is replaced every 4–6 years; facilities must be flexible enough to keep up.
Facilities designed today must anticipate at least two more generations of AI hardware over their life.
8.2ENERGY SOLUTIONS
Powering the build-out: the energy options.
No single source will meet demand; operators are assembling portfolios of grid, on-site and contracted power.
Option
What it is
Availability
Role
Grid expansion
New transmission lines, substations and utility generation
Multi-year
The long-term backbone
On-site natural gas
Turbines or engines generating power at the campus
Months to 2 years
Bridge and primary power
Fuel cells
Electrochemical power on site, low local emissions
Growing
Firm, modular supply
Battery storage
Large batteries for peak shaving and grid support
Widely available
Flexibility and backup
Solar and wind contracts
Long-term power purchase agreements
Mature
Clean energy matching
Nuclear
Long-term contracts, plant restarts, future small reactors
Contracts now; SMRs 2030s
Firm, carbon-free power
Geothermal
Steady heat-based power, e.g. California’s Imperial Valley
Emerging
Firm clean power
Demand flexibility
Shifting or reducing AI workloads at grid peaks
Emerging
Faster interconnection
Storage and demand flexibility reduce the peak power a site must draw from the grid, which can speed interconnection.
8.3EMERGING TRENDS
Six trends shaping the next generation of facilities.
Technology, construction and operating models are all changing at once.
Prefabrication
Power and cooling modules built in factories and assembled on site to cut months from schedules.
Liquid everywhere
Liquid cooling moves from niche to standard, with warmer water and less chiller energy.
Digital twins and AI operations
Facilities designed, commissioned and run through live virtual models and AI control.
Robotics and automation
Robots for drilling, layout, inspection and, increasingly, hands-on operations.
Heat reuse and sustainability
Waste heat supplied to communities; water-free cooling; cleaner backup power.
Sovereign AI and edge inference
Countries and companies building local AI capacity; inference moving closer to users.
8.4OUTLOOK AND CHALLENGES
Demand stays ahead of supply through 2027.
The leaders will deliver power and capacity fastest, and run it most efficiently.
Power scarcity
Interconnection, transformer and switchgear lead times now set project timelines.
Cost allocation
States, led by California, are making data centers pay more of grid and generation costs.
Efficiency plateau
Average PUE has barely moved in six years; each point improved frees capacity.
Density shift
AI racks at 40–130+ kW force a redesign of power and cooling systems.
Water and community
Local opposition and permitting now rank alongside power and fiber in site selection.
Capital intensity
Hyperscaler capex is outrunning cash flow, raising questions about cycle durability.
The industry’s challenge is no longer finding demand; it is delivering power, equipment and people on time.
8.5KEY TAKEAWAYS
Ten things to remember about data centers.
The essentials of the primer on one page.
01
A data center turns electricity into computing; capacity is measured in megawatts.
02
Demand from AI and cloud far exceeds supply; vacancy is at a record low.
03
Power availability, not land or capital, now decides where facilities are built.
04
Every watt becomes heat; cooling is the largest overhead and the main efficiency lever.
05
Redundancy (N+1, 2N) and Tier ratings define how reliable a facility is.
06
Greenfield delivery takes 2–4 years; permits and long-lead equipment set the pace.
07
Digital twins let owners design, test and operate facilities virtually first.
08
Skilled people are scarce; robots are starting to take on repetitive, precise tasks.
09
Building costs ~$11M per MW; AI-ready facilities $20M+, and IT costs more again.
10
Long leases and ~10–11% yields on cost make stabilized data centers valuable assets.
Appendix A
Visual guide
What a data center looks like, from the outside in.
Real photographs of U.S. facilities and the equipment inside them, in the same order as the primer. Each page names what is shown, where it is, and the part of the primer it illustrates. Select a photo to enlarge it and see what it shows.
The outside
Inside the data hall
Types of facilities
Power
Cooling
Network and controls
Security and fire safety
Construction and commissioning
Digital twins, operations and robots
Energy supply
Appendix B
Reference
A working vocabulary and the key numbers, in one place.
B.1GLOSSARY: A–H
Glossary of key terms (A–H).
The vocabulary used across design, construction, operations and finance.
Term
Meaning
Adiabatic cooling
Cooling incoming air by evaporating a small amount of water
AFFO
Adjusted funds from operations: a REIT’s cash earnings after recurring capex
Availability
Share of time a system is up and serving its load
BIM
Building information modeling: the 3D digital design record
BMS
Building management system: monitors and controls mechanical systems
Busway
Overhead power rail that racks plug into
Cap rate
Net operating income divided by asset value
CDU
Coolant distribution unit: links the IT liquid loop to facility water
CFD
Computational fluid dynamics: simulation of airflow and heat
Chiller
Machine that removes heat from water with a refrigeration cycle
Colocation
Renting space, power and cooling in a shared facility
Commissioning
Structured testing of systems before handover (levels L1–L5)
CRAH / CRAC
Computer room air handler / computer room air conditioner
Critical IT load
Power capacity available to IT equipment
Cross-connect
A cable linking two parties inside a data center
DCIM
Data center infrastructure management software
Digital twin
Live virtual model of a facility, kept in sync with real data
Direct-to-chip
Liquid cooling through cold plates mounted on processors
Economizer
Free cooling using outside air or water when weather allows
Edge data center
Small facility located close to users for low latency
Hot / cold aisle
Racks arranged so intakes face a cold aisle, exhausts a hot aisle
Hyperscaler
Company operating cloud at massive scale: AWS, Microsoft, Google, Meta, Oracle
B.2GLOSSARY: I–Z
Glossary of key terms (I–Z).
The vocabulary used across design, construction, operations and finance.
Term
Meaning
Immersion cooling
Servers submerged in non-conductive fluid
Interconnection
Direct links between networks, clouds and customers
IST
Integrated systems test: the final, whole-facility commissioning test
kW per rack
Power density of a rack; drives the cooling method
Meet-me room
Room where carriers and customers physically interconnect
MOP
Method of procedure: step-by-step plan for work on live systems
N, N+1, 2N
Redundancy levels: needed capacity, plus a spare, or fully doubled
A building with power delivered; the tenant fits it out
PUE
Power usage effectiveness: total facility power ÷ IT power
Spine and leaf
Network design where every leaf switch links to every spine
Tier (I–IV)
Uptime Institute reliability classification
UPS
Uninterruptible power supply: batteries that bridge outages
Vacancy
Share of built capacity that is not leased
White / grey space
IT rooms / supporting power and mechanical space
Wholesale
Leasing whole halls or buildings to a single tenant
WUE
Water usage effectiveness: liters per kWh of IT energy
Yield on cost
Stabilized net operating income ÷ total development cost
B.3QUICK REFERENCE
Key numbers and rules of thumb.
Indicative figures for fast reference in discussion.
Topic
Rule of thumb
Power and homes
1 MW of IT ≈ power for ~750 homes
Build cost
$11.3M/MW building; $20M+ AI-ready; $30–45M with IT
Rent
~$170–250 per kW per month (U.S. primary)
PUE
~1.54 average; 1.1–1.2 best in class
Rack density
5–15 kW enterprise; ~120 kW AI rack
Air cooling limit
~30–40 kW per rack; liquid beyond
Server inlet
~18–27°C (ASHRAE recommended)
Delivery
2–4 years greenfield; 12–18 months construction
Transformers
~128 weeks average; up to 3–5 years
Tier III
99.982% availability (~1.6 hours a year)
Returns
10–11.5% yield on cost; ~6% cap rate
U.S. electricity
4.4% (2023); 6.7–12% projected by 2028
Latency
~1 ms round trip per 100 km of fiber
Backup power
Batteries 5–10 min; generators start in ~10 s
B.4INDUSTRY ORGANIZATIONS
The organizations that shape the industry.
Standards bodies, research groups and associations that define practice and represent the sector.
Organization
What it does
Uptime Institute
Tier certification, research and the annual global survey and outage analysis
TIA (Telecommunications Industry Association)
ANSI/TIA-942 data center infrastructure standard
ASHRAE TC 9.9
Thermal guidelines for IT equipment environments
NFPA
Fire and electrical safety codes, including NFPA 70, 75, 76 and 110
BICSI
Design and cabling best practices; BICSI 002 data center standard
The Green Grid
Efficiency metrics, including PUE and WUE
Open Compute Project
Open hardware designs for racks, servers and power
Data Center Coalition
U.S. industry association for data center policy
AFCOM and 7x24 Exchange
Professional communities for data center and mission-critical operators
iMasons (Infrastructure Masons)
Network of digital infrastructure professionals
Atomgigs for data centers
Building, fitting out or operating a data center?
Atomgigs supplies and manages skilled crews, brings in proven robots alongside them, and orchestrates hybrid human-robot workforces over time. Tell us about the site, the scope and the schedule.